Editor’s note: The proper size and structure of the administrative workforce is a topic of regular discussion in higher education communities all over the country, including the University of Virginia. The University recently conducted an analysis of employment trends within the Academic Division of the University, focused on how the workforce has changed and what may be driving those changes. UVA Today is sharing information on the topic to help enhance understanding of our evolving University.
Assessing the Changing Nature of UVA’s Workforce

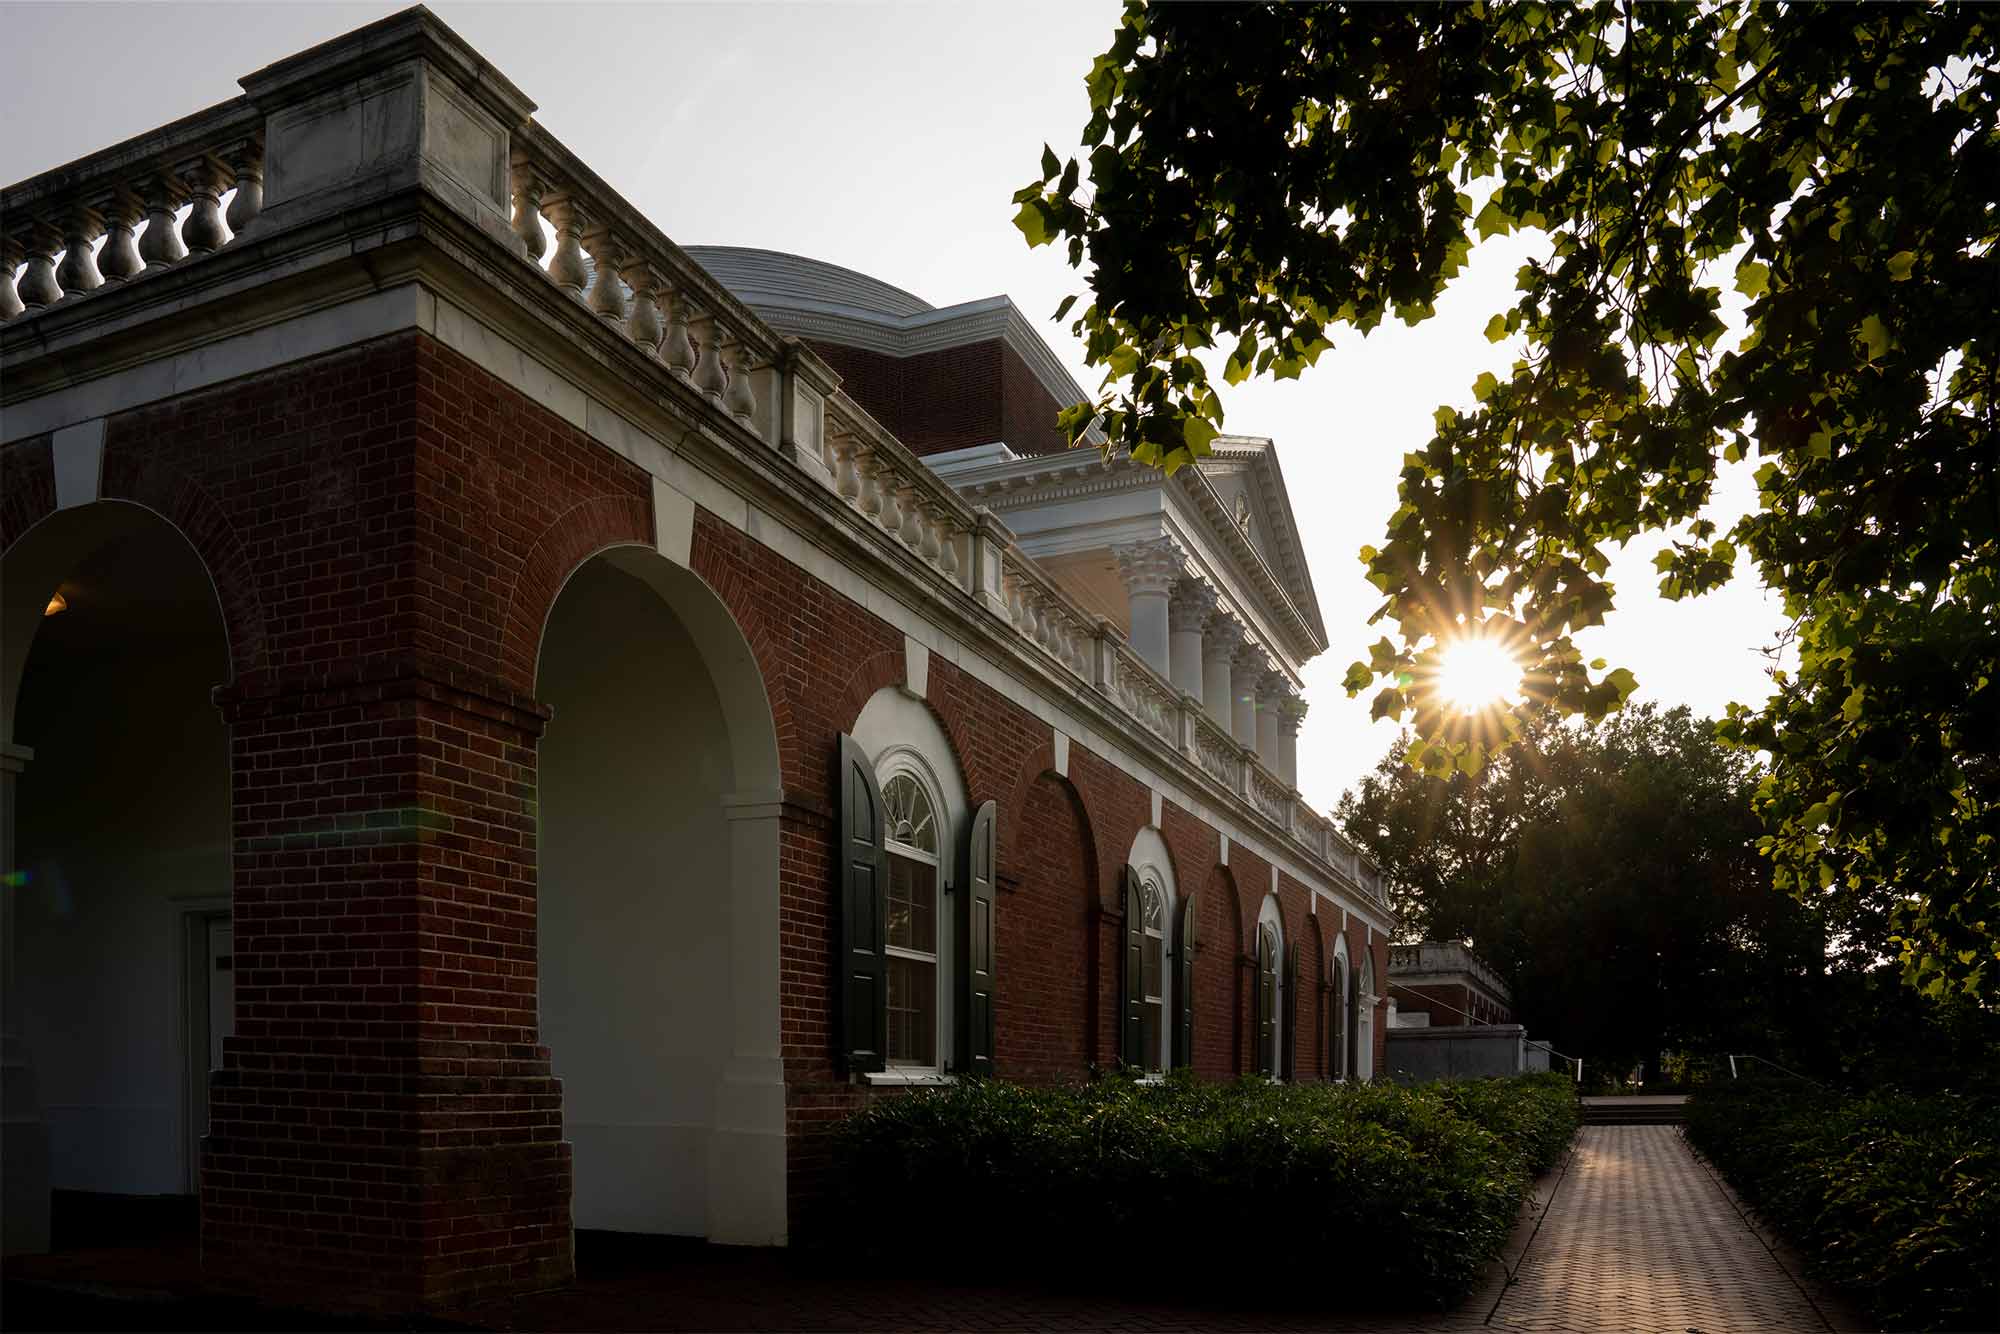
(Photo by Sanjay Suchak, University Communications)
As it has progressed and grown more complex, the University continues to operate with the highest possible industry standard for sound financial management and stability. It remains one of only four public institutions in the country to receive an AAA bond rating from all three major independent credit-rating agencies – a rating that ensures UVA receives the best possible interest rates for projects it finances.
For the full decade between 2012 and 2022, the Academic Division, which includes all 12 schools, experienced steady growth, fueled by rising student enrollment, the addition of academic units and student services, a surging research enterprise, additional public safety resources, and substantial additions to UVA’s physical infrastructure.
During the 10-year period:
- Total Academic Division employment grew at a rate of 2% annually, from 8,507 to 10,188, a total increase of 19.8%.
- Faculty increased by 26.9% from 2,400 to 3,045 (excluding administrative and professional faculty, who do not provide classroom instruction).
- Faculty’s portion of overall Academic Division employment increased from 28% to 30%.
- The Common Data Set student-to-faculty ratio decreased from 15.8 to 14.1.
- Administrative staff increased by 17.4%, from 6,084 to 7,143.
Other factors help illustrate the change in the Academic Division over the past decade.
Total student enrollment – including degree-seeking, non-degree-seeking, and certificate-seeking students – increased by 9.4% over the decade, from 23,907 undergraduate and graduate students to 26,149.
Administrative and research-related staffing also increased as UVA’s research enterprise has grown more robust. Sponsored research (funding for research that is secured from sources such as the federal government) increased from $89 million to $443 million.
Academic Division 2018-2022
Taking a closer look at the period between 2018 and 2022, UVA continued to increase enrollment and research activity, launched a $5 billion fundraising campaign, and established the School of Data Science. Despite those major drivers of workforce activity, employment growth at UVA actually slowed during this period, in part due to the impact of the COVID-19 pandemic on University operations.
During the most recent four-year period:
- Administrative staff increased by 2.2%, from 6,989 to 7,143.
- Total Academic Division employment increased by 3.2%, from 9,868 to 10,188.
- That equals an annual average growth rate of 1%.
- Faculty increased by 5.8%, from 2,879 to 3,045.
- Total student enrollment increased by 6.13%, from 24,639 undergraduate and graduate students to 26,149.
In addition to the School of Data Science, the University since 2018 has added the Biocomplexity Institute; opened a new Student Health and Wellness center with expanded services in areas including mental health counseling, health promotion and well-being; created the Karsh Institute of Democracy; and announced the Paul and Diane Manning Institute of Biotechnology. UVA also has increased resources dedicated to public safety and security, state and federal regulatory compliance, and invested in providing more academic programming and research in Northern Virginia.
In June, UVA received Money magazine’s highest, five-star rating based on quality, affordability and student outcomes. In April, Princeton Review ranked UVA as the No. 2 Best Value public university in the country, and the top public university for financial aid.


