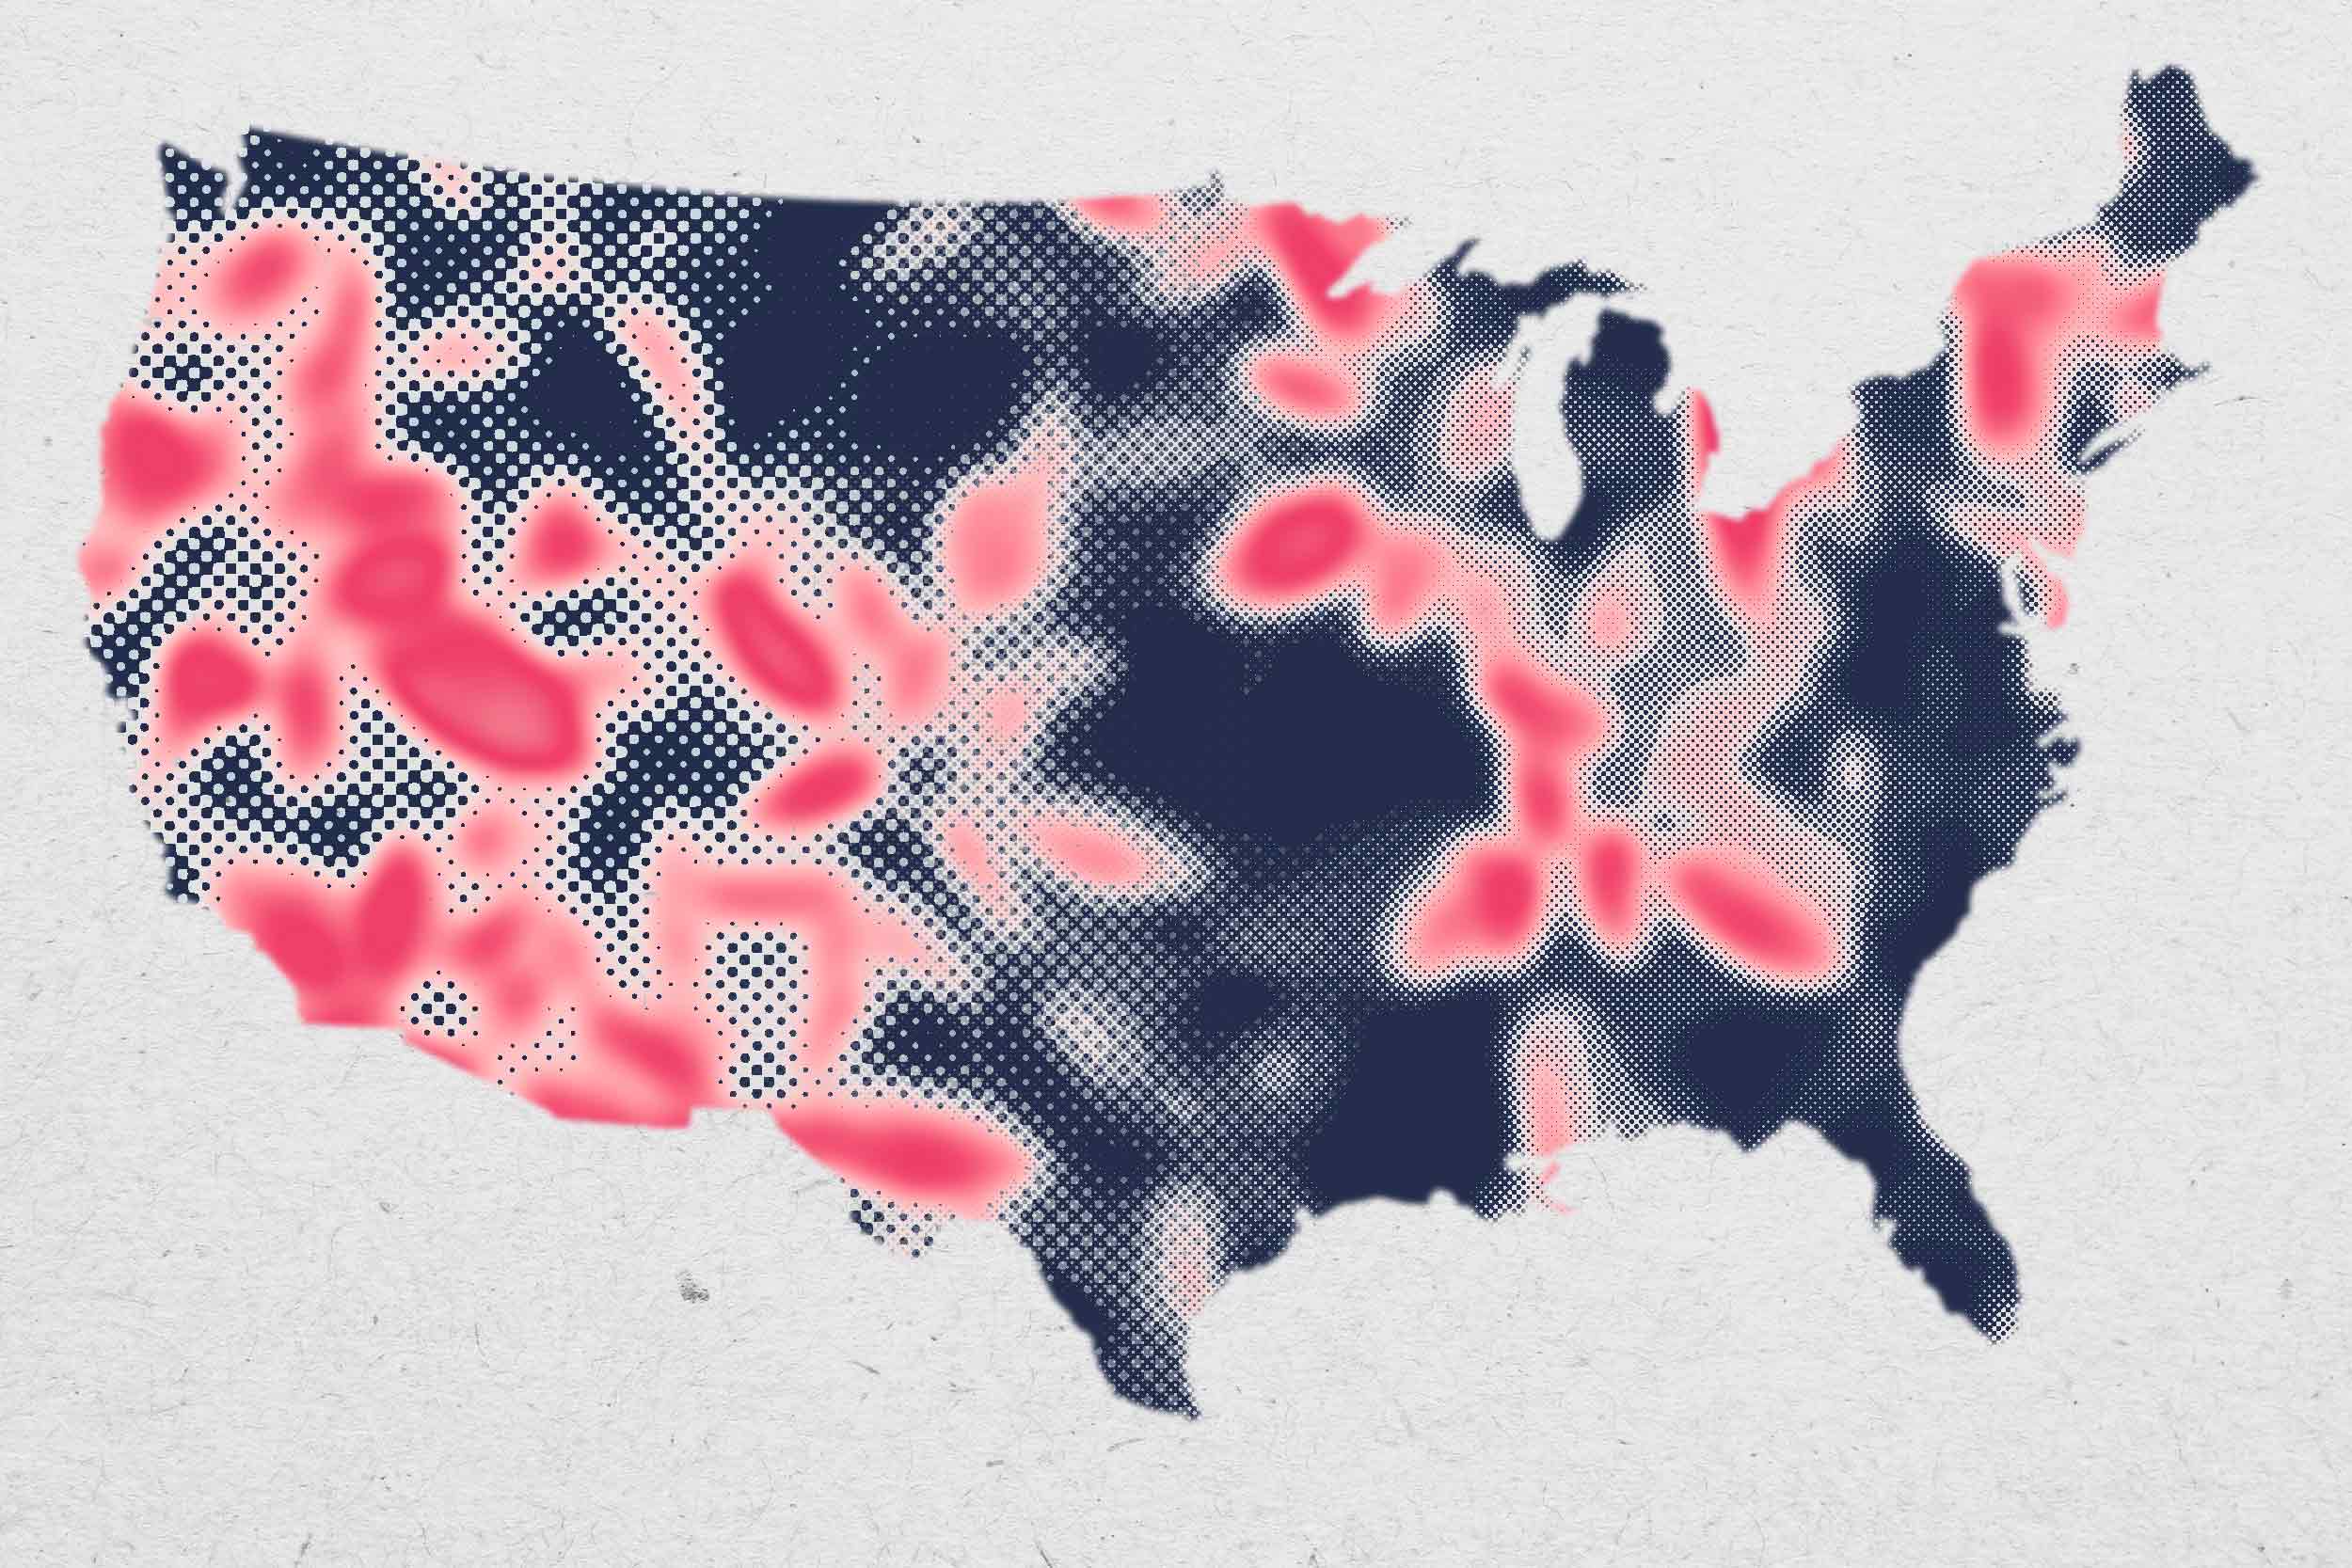
The way election maps are colored could change voters’ perceptions about power and polarization. (Photo illustration by Emily Faith Morgan, University Communications)
Election maps showing states as only red or blue contribute to voters’ sense of political polarization, according to research that included two University of Virginia experimental psychologists, but those with color gradients representing more detailed results could help ease that perception and may encourage others to vote.
The study, “Red and Blue States: Dichotomized Maps Mislead and Reduce Perceived Voting Influence,” was published Thursday in the online journal Cognitive Research: Principles and Implications. The research shows that standard news media political maps mislead voters when published in a single color according to which political party wins presidential and state elections.
The studies show such maps tend to inflate perceptions about margins of victory and may lead to discouraged voters who see their votes as counting for less.
The problem is not with the colors, but with the winner-takes-all nature of the two-color map legend, said researcher Rémy A. Furrer, who was a graduate student in social psychology at UVA when he was involved in the studies along with UVA psychology professor Adrienne Wood.
“We went into this with the idea of hue being one of the mechanisms for the polarization of voting estimates, but what we eventually found out is that the actual hues didn’t have an effect,” said Furrer, who is now a postdoctoral researcher applying psychology to bioethics at Harvard Medical School.
What emphasized the divide was the dichotomous representation of voting margins as either Republican or Democrat without representing vote totals of both parties at the local level.
That lack of granular voting information across states led voters to overestimate the margin of victory for the winning party, the research indicates.
“The main findings were that, when presented with dichotomous coloring as opposed to continuous gradations, people overestimated the voting margins and reported that their vote would have mattered less,” Furrer said.
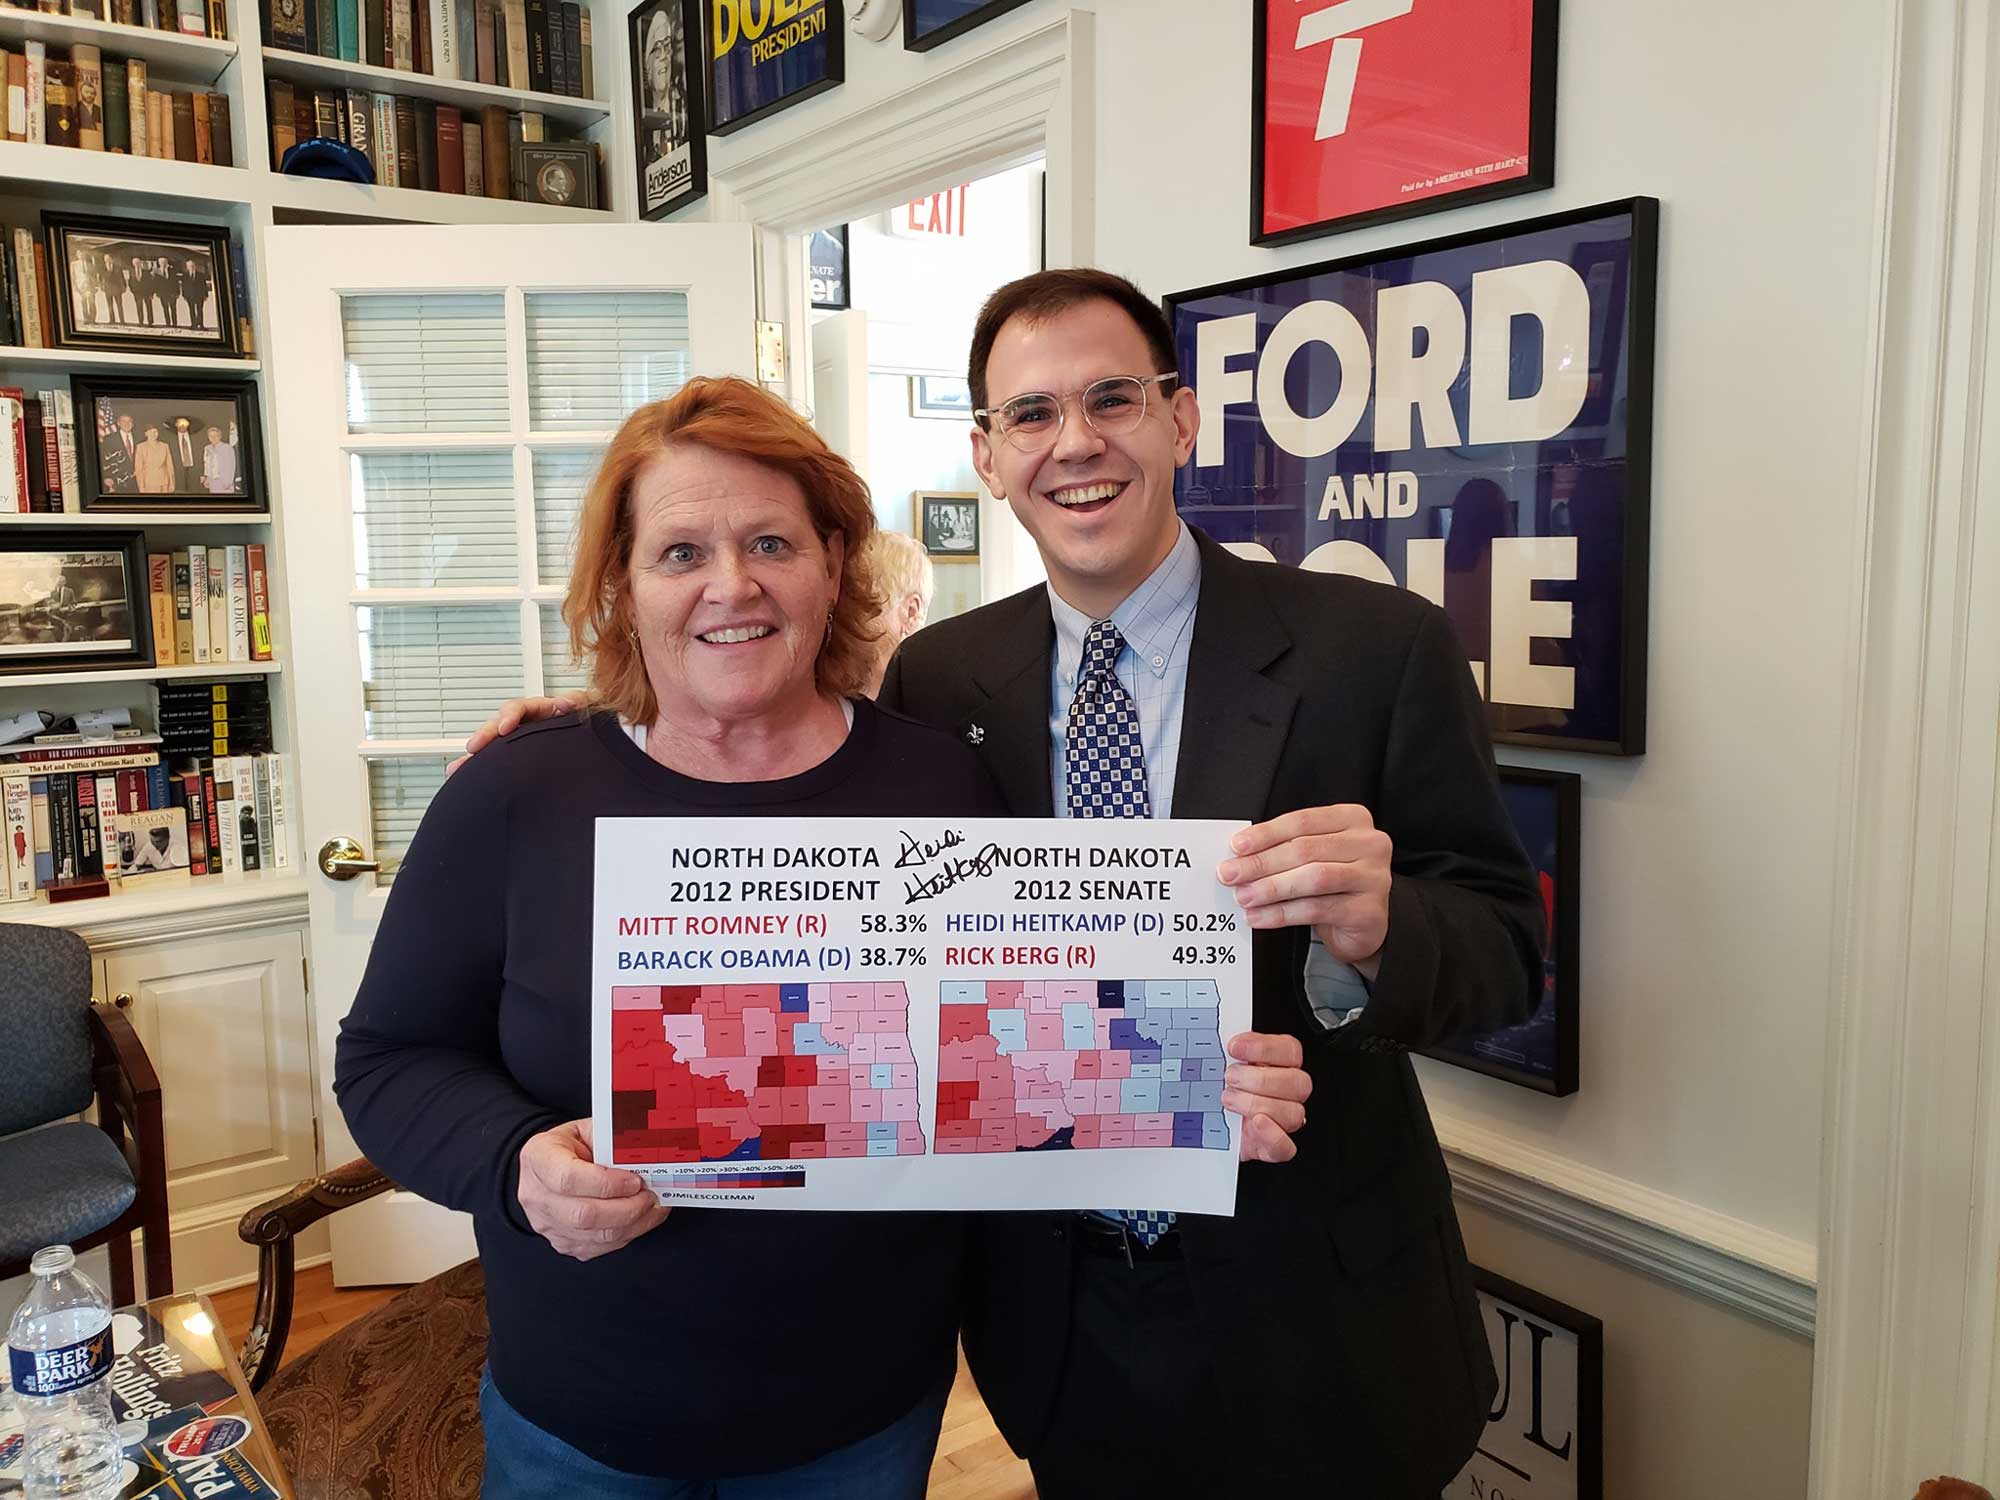
Former Sen. Heidi Heitkamp, D-North Dakota, met with J. Miles Coleman of the UVA Center for Politics in 2019 and signed a copy of Coleman’s election map of her 2012 victory for the U.S. Senate. (Contributed photo)
The study also found that creating a map with continuous hue and lightness gradients reflecting results at the state level would more accurately depict votes of both Republicans and Democrats. It also showed that providing people with a better visual representation of actual victory margins can make them feel that their vote matters more in states with narrow margins.
“When we represented the voting margins with continuous gradients, the participants thought their vote would have been more influential than with dichotomous gradient steps in winner-take-all maps,” Furrer said. “[Voters] believe that, if the voting margins are smaller, their vote matters more, even though all votes matter in the grand scheme of things.”
The current labels of red and blue states are not rooted in American political tradition. They are the result of news media coverage of previous presidential elections. The colors became a part of American political rhetoric during the 2000 contest between George W. Bush and Al Gore, which came down to a thin margin of fewer than 2,000 votes in Florida.
The election took more than a month, several lawsuits and a U.S. Supreme Court ruling to resolve. It was finally settled with Bush getting one vote more than the 270 needed to win the Electoral College.
“The 2000 election cemented the current red/blue party assignments in the public sphere,” said J. Miles Coleman, a political cartographer by trade and associate editor of Larry Sabato’s Crystal Ball, a blog published by the UVA Center for Politics. “I agree on the point about gradients being useful, especially compared to a flat red/blue.”
Kyle Kondik, managing editor of Sabato’s Crystal Ball, said maps showing only two colors in winner-takes-all vote reporting provide an inaccurate view of election results. (Contributed photo)
Coleman said the red and blue political dichotomy was quickly adopted in political circles.
“In his 2004 Democratic National Convention speech, [then-Sen. Barack Obama of Illinois] had a line that went something like, ‘America is more than just a collection of red states and blue states.’ He used variations of that idea in his later speeches, so even by then, it seemed to be part of the vernacular,” Coleman said.
“Sarah Palin played it the other way in her rhetoric. In 2008, she’d talk fondly of ‘real America,’ which could probably be viewed as a stand-in for ‘red’ America,” he said.
Maps showing large areas of land in one color or the other became symbols for parties to show their dominance.
“Something I’ve run into more recently, especially on Twitter, is that Democrats – especially the anti-Trump ‘resister’ types – don’t like maps that are predominantly red, even if I’m trying to show a Democratic win,” Coleman said. “My theory behind that is Trump, when he was president, would always brag about and post the 2016 election map, which was mostly red. Trump, as basically any Republican would, won more land mass.”
“After the 2004 election, I remember fans of President Bush, including one of my buddies in college, hanging ‘Bush Country’ posters showing the county-by-county results across the country,” recalled Kyle Kondik, managing editor of Sabato’s Crystal Ball. “As Miles suggested, those maps inherently make elections look like Republican blowouts because of the GOP’s strength in less-populated areas [that cover larger geographic territory].”
In their study, the researchers changed map colors to rule out the colors themselves as polarizing catalysts.
“That’s why we presented some of the maps with novel colors. In the first study, we found that using novel colors decreased voting polarization, but that’s because we purposefully didn’t label and associate the color scales with a political party,” Furrer said. “People naturally inferred that blue and red must be Republican and Democrat, but when they saw orange and green, they didn’t make the association.”
In the second study, researchers labeled the color scales and did not find an effect of hue on perceived voting polarization.
“We found no effect by changing the hues, which suggests it’s more about the data granularity, showing actual results on the map,” Furrer said. “One interesting finding is that people, on average, overestimated the voting margins.”
Furrer said the study shows that adding more information to a political map could lessen the sense of us-vs.-them pervading politics, an idea that was in other research.
“When the media want to quickly show the electoral results, they use a dichotomous, winner-takes-all map. We’re proposing using a continuous hue and lightness solution where you can demonstrate more granular results while still showing who won,” Furrer said.
“The goal would be to get media and political map designers to change the way they represent election results,” he said. “Our results suggest that using continuous gradation from red to white to blue provides an effective solution that can be easily implemented in the design of political maps. It would be a simple solution to help decrease those types of misperceptions.”