An engaging new interactive map created by demographic researchers at the University of Virginia displays more than 308 million points – one for each person residing in the United States. Though just ‘live’ last week, hundreds of thousands of people nationwide have already viewed the online map and used it to explore the cities and neighborhoods in which they live.
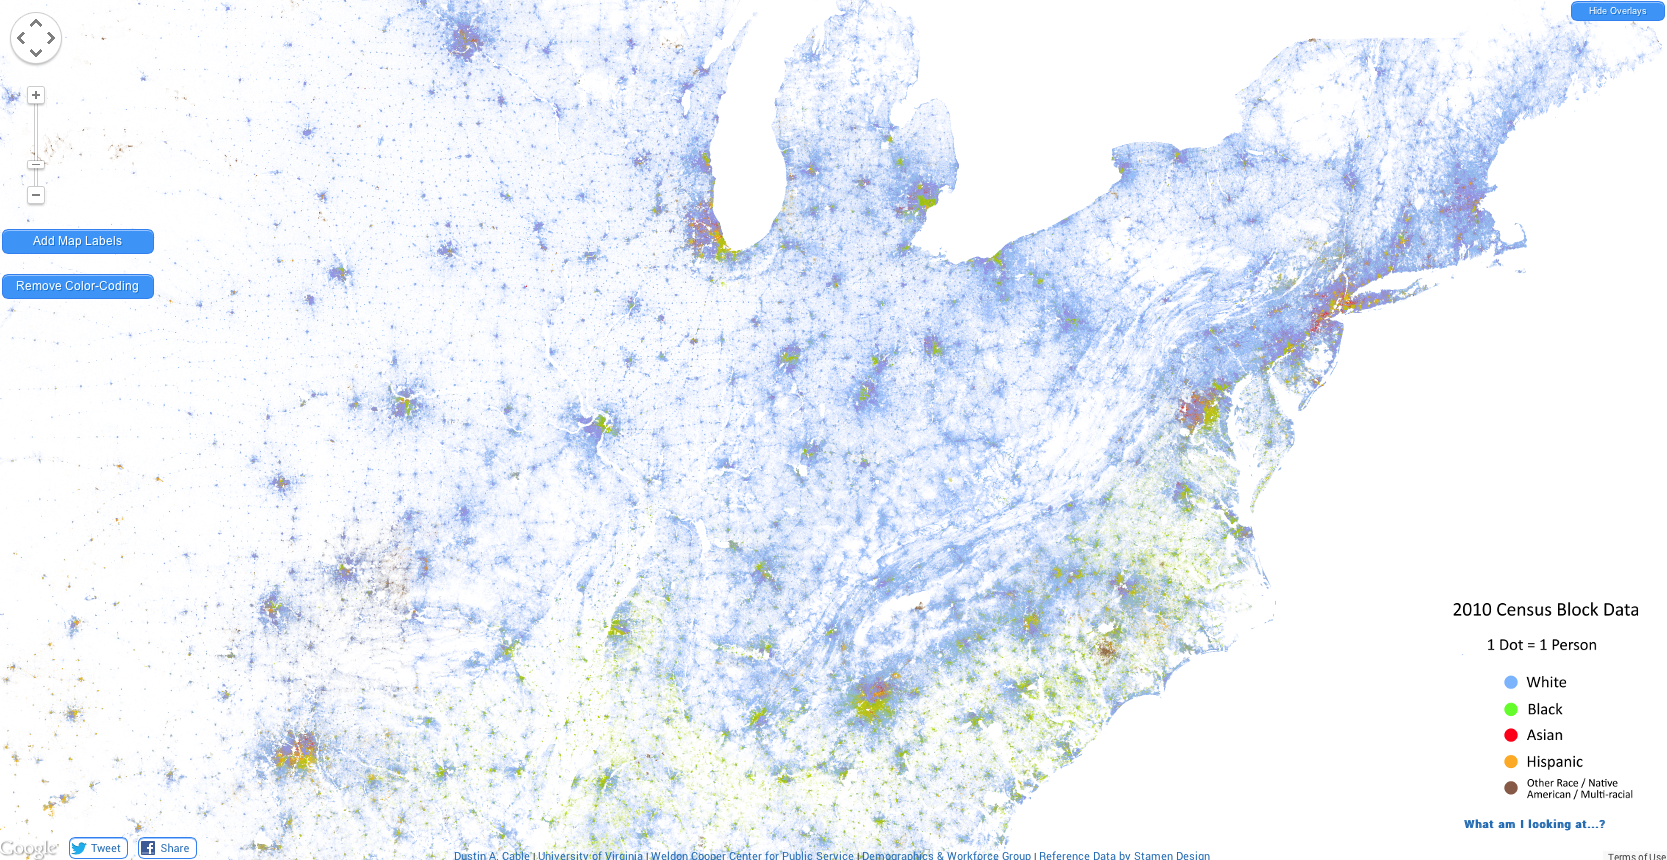
The new map provides an innovative visualization of the geographic distribution, population density and racial diversity of every neighborhood in the entire country. The map, the only one of its kind to apply racial and ethnic data from the 2010 U.S. Census, allows users to zoom from the national level – at which many points overlap, reflecting density – down to neighborhood levels, where individual points are visible.
“I created the map mostly out of curiosity after seeing the original Census Dotmap developed by Brandon Martin-Anderson,” said Dustin Cable, senior research associate at the Weldon Cooper Center for Public Service’s Demographics & Workforce Group. “Starting with that idea, I added racial data from the Census Bureau. I then plotted the points, made the images and hosted it through Google Maps. The entire code is open for people to see and use as they wish on GitHub.”
“Many have described it as demographic artwork,” said Qian Cai, director of the Demographics & Workforce Group. “What makes this map stand out is that each point is color-coded by race and ethnicity information contained in census data. While all that data could be overwhelming, this map elegantly, and beautifully, conveys thousands of pages of information in a simple, intuitive way. It is easy to see areas of high population density and racial concentrations across regions at one glance.”
The new map, available for use by anyone with an interest, will be a powerful resource for teachers and students, and will be useful in planning for transportation, housing construction, schools and other functions of government. Researchers also expect private-sector employers may use the information to understand more about their customers and markets.
Media Contact
Demographics Research Group, Weldon Cooper Center
meredith.gunter@virginia.edu 434-982-5585
Article Information
August 20, 2013
/content/dynamic-map-created-uva-researchers-draws-national-attention