
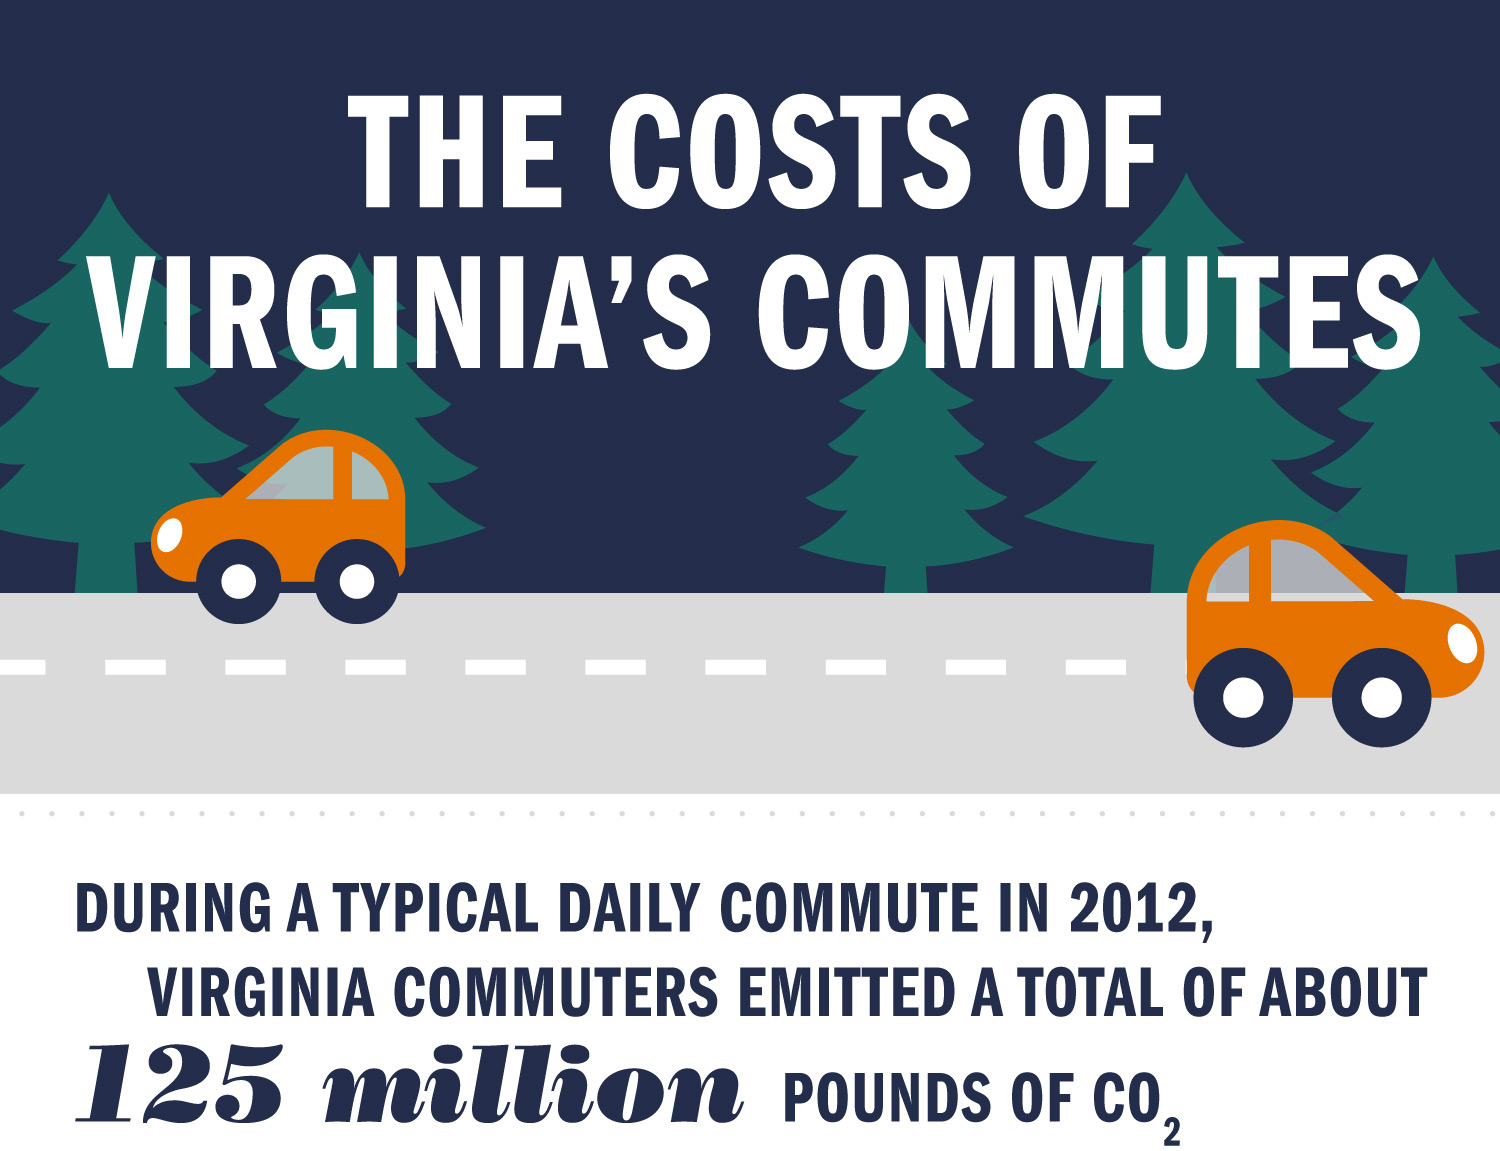
Amid the many indicators of America's growing political divide, there’s one you might not have thought about: your daily commute.
A recently published study by Andrew Mondschein, a professor in the University of Virginia’s School of Architecture, and Emily Parkany, research manager at the Vermont Agency of Transportation who previously worked at UVA's Center for Transportation Studies, used survey and vehicle registration data to measure vehicular carbon dioxide emissions and commute mileage in Virginia’s 2,373 voter precincts and identify “sustainability sweet spots” – areas showing short commutes and low emissions.
They compared that data with demographic information and results of the 2008 presidential election between then-Sen. Barack Obama and Sen. John McCain.
Results broke down along party and demographic lines and foreshadowed the divisions that supercharged the 2016 presidential elections.
According to Mondschein, this result does not necessarily indicate that one demographic or political party is more sustainable. Instead, it shows how sustainability policies fail to account for demographic trends like access to jobs in rural areas and the growing cost of urban housing pushing people further from their jobs.
Take a look at the data and the county-by-county results below.
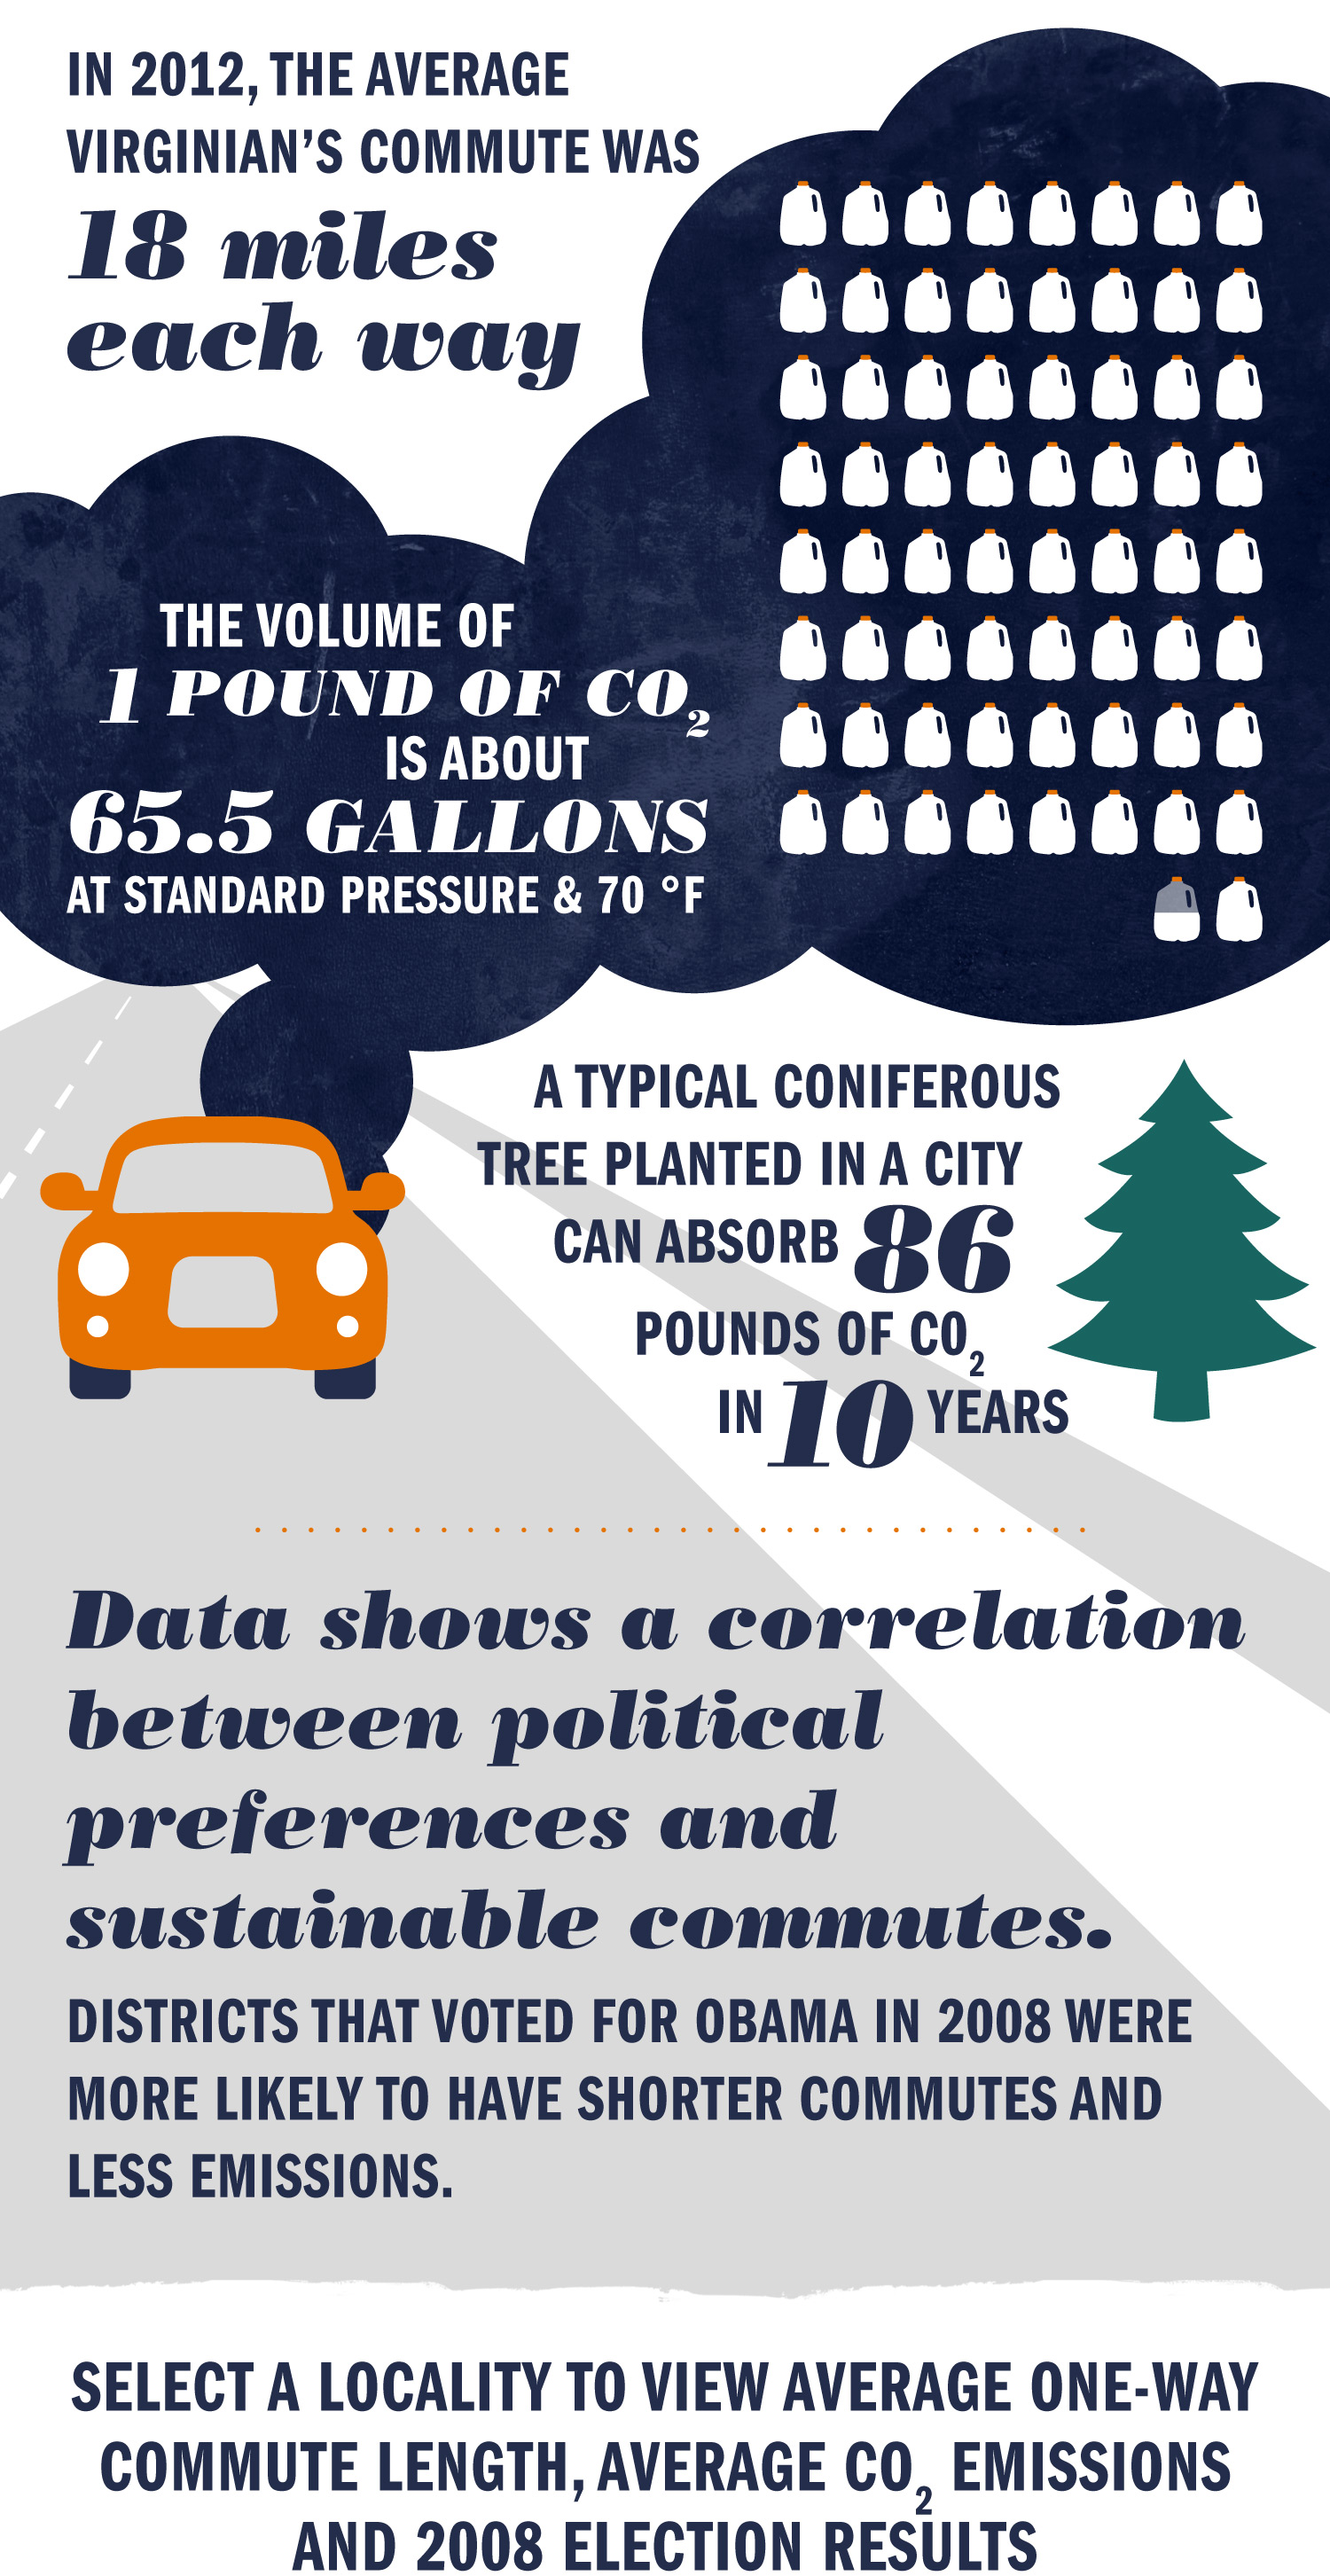
As seen above, Virginians in more urban areas tended to commute shorter distances, emit less CO2, drive more hybrid vehicles and vote for Obama. Those in rural areas often faced longer commutes, had higher CO2 emissions and largely voted for McCain.
Mondschein said this divide is a warning that policymakers must focus on the unique needs and challenges that different communities face, realizing that some sustainability choices, such as driving an electric car or cycling to work, might not be feasible for large swaths of the population. Often the local, accessible jobs that make those choices possible are not available.
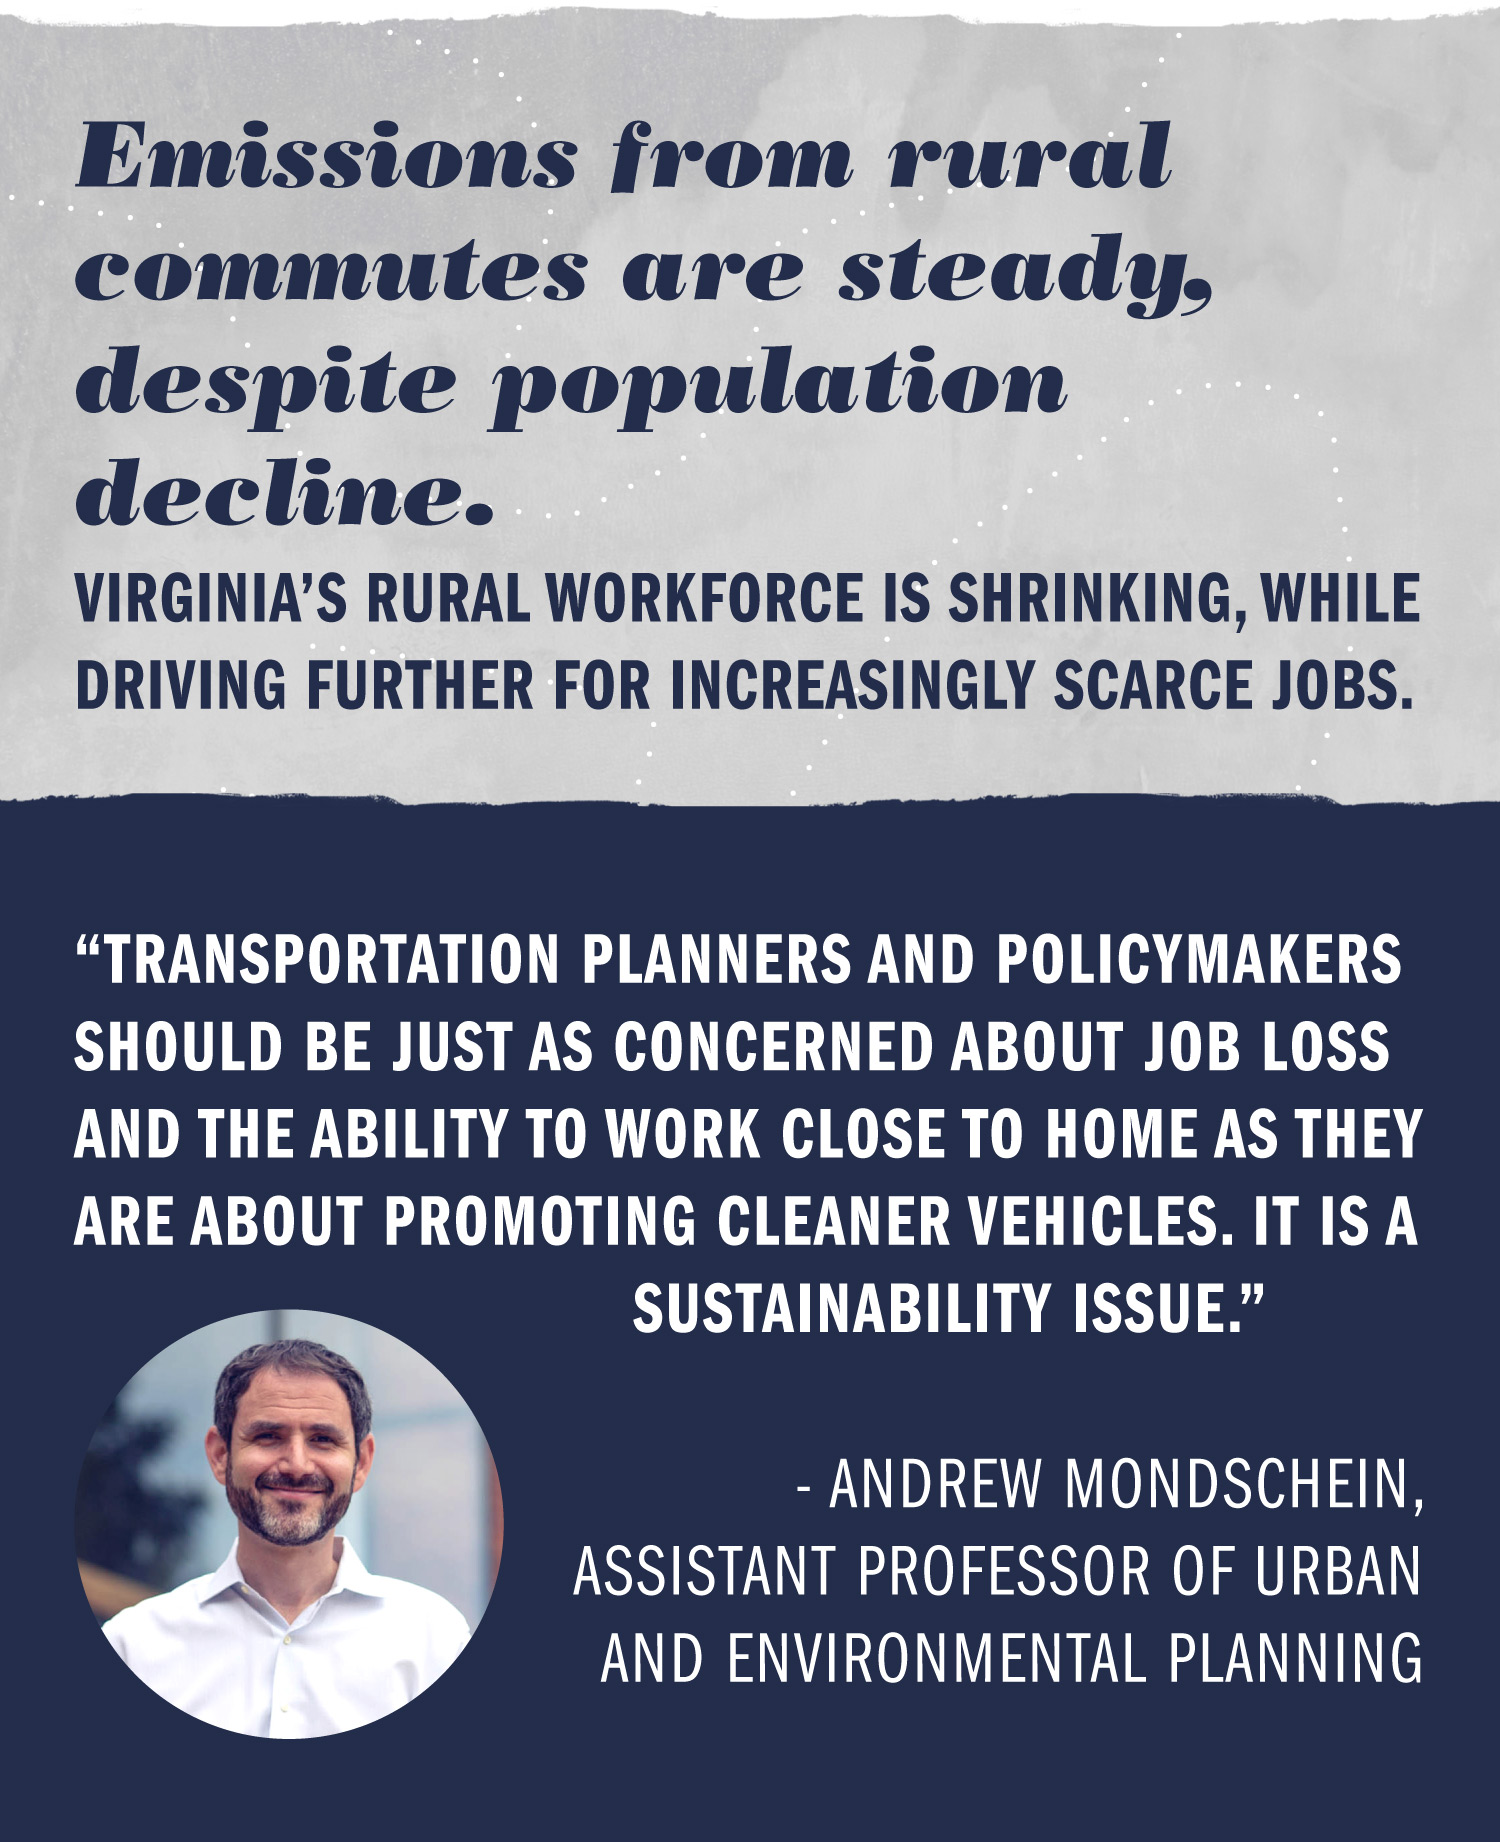
“Transportation planners and policymakers should be just as concerned about job loss and the ability to work close to home as they are about promoting cleaner vehicles,” Mondschein said. “It is a sustainability issue.”
Mondschein cited himself as an example. He drives an electric car – a choice made feasible because he lives near Grounds in a town where electric vehicles are more common. For someone in rural Virginia with a longer commute, that choice might make less sense, and policies focusing mostly on electric or cleaner vehicles could seem irrelevant or even alienating.
“These communities may feel increasingly out of sync with other parts of the state and with policies that don’t recognize local conditions,” Mondschein said. “I think we owe it to ourselves to ask if, with a common vision of a healthy Earth, there are policies that we can come up with that are win-wins for all parts of our diverse state and economy.”
In addition to Mondschein’s study, data for the above infographic came from Environmental Protection Agency databases tracking greenhouse gas emissions for passenger vehicles and greenhouse gas equivalencies; and from the Virginia Elections Database.
Media Contact
Article Information
September 1, 2017
/content/how-americas-political-divide-reflected-your-daily-commute