
Based on population statistics, every locality has a unique identity that tells a story about its past, present and future demographic change. It’s just not always so easy to see on a spreadsheet.
That’s what makes Kathryn Crespin’s work so helpful.
Based on 2017 Census Bureau population estimates, Crespin, a researcher at the University of Virginia’s Weldon Cooper Center for Public Service, constructed “population pyramids,” graphics that show the distribution of Virginia’s local and regional populations by age group and sex. To allow comparisons of different-sized populations, the pyramids use percentages rather than raw population numbers.
The results allow a viewer to get a quick sense of how the population of given parts of the state break down by age and gender, and to get a sense of how different those distributions can be across the commonwealth.
When you combine all those data points, the population of Virginia has a distribution like this:
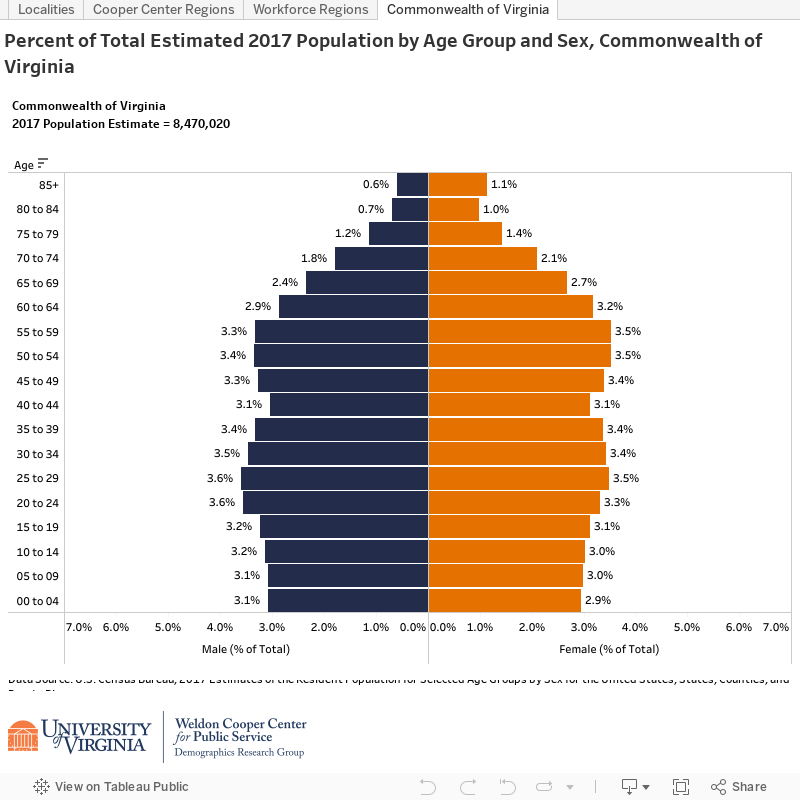
The effects of the larger baby boom and millennial generations on Virginia’s age distribution are reflected in the state’s population pyramid as wider bars, or bulges, in the 50-year-old and 20- to 30-year-old age groups.
As you would expect, the smallest population segments for both males and females are the 80-and-over age groups, with females (2.1 percent) outnumbering males (1.3 percent).
Many of the most interesting differences and trends that emerged in Crespin’s new visualizations surface when localities are separated out from the state.
“One thing that was striking to me was seeing the impact that colleges and universities have on the populations of the cities where they’re located,” Crespin said.
One prominent example was the city of Lexington, home to both Washington & Lee University and Virginia Military Institute, where nearly 20 percent of the population is 20- to 24-year-old males. Though it sounds obvious to say a small college town has a lot of students in it, the data visualization shows just how strong those demographics are.

To examine other localities in the state, use the drop-down window and select a locality.
Charlottesville’s pyramid, accessed by selecting “Charlottesville” in the drop-down window, shows that more than 28 percent of the population is between the ages of 20 and 29.
The visualizations show more than just the concentration of college students. They also shed light on where Virginians like to retire, where working-age residents of the state clock in and out, and where baby boomers live.
Crespin said Lancaster County is one strong example of an aging population that, according to other research conducted by the center, reflects recent trends in the migration of retirees to the state.
“You have a much larger older population and a smaller, younger population, which makes the population pyramid look top-heavy as a result,” she said. “The great thing about population pyramids is that they allow users to quickly identify and classify the age structure of a population in a visual way that’s not always possible when viewing the stats in a column on a spreadsheet.”
Another illuminating pyramid is the Alexandria/Arlington Workforce Region, which, due to its young, working-age population, resembles a Christmas tree.

Visit the Weldon Cooper Center’s Stat Chat blog for more visualizations.
Media Contact
Article Information
August 16, 2018
/content/how-old-your-citys-population-check-out-its-population-pyramid