Looking at Virginia as made up of eight regions shows that the median household income in Northern Virginia of $102,499 is almost double – and, in some places, triple – that of other areas in the state, according to demographers at the University of Virginia’s Weldon Cooper Center for Public Service.
Three years ago, the demographers defined eight regions of Virginia based on 2010 Census and American Community Survey data. This week, the Cooper Center released new profiles of those regions using updated data from the 2008-2012 American Community Survey.
The profiles include information on population size and change; age, race and ethnicity; educational attainment; income and poverty; labor force participation and employment; and health insurance coverage.
“Understanding Virginia’s regional differences is important in designing and providing programs and services to address the varying needs of Virginians across the commonwealth,” said Qian Cai, director of the Cooper Center’s Demographics Research Group. “It is also important to keep in mind that statewide statistics are driven by trends in Northern Virginia and obscure the realities of other parts of the state. For example, 6 percent of households in Northern Virginia fall below the poverty line while poverty rates are in double digits in all other regions.”
This year’s update includes, for the first time, information on health insurance coverage among Virginians. Consistent with rates of poverty, rates of receipt of Medicaid benefits are highest in Southside and Southwest Virginia (above 17 percent) and lowest in Northern Virginia (6 percent). Statewide, more than 10 percent of the population has no health insurance.
In addition to two-page profiles of each region, the results are summarized in a table that allows quick comparisons across the regions.
“The wide range in multiple demographic and socioeconomic indicators highlights vast differences in Virginia’s regions,” said demographer Shonel Sen, who prepared the profiles. “The Richmond region is the only one that closely resembles the state as a whole.”
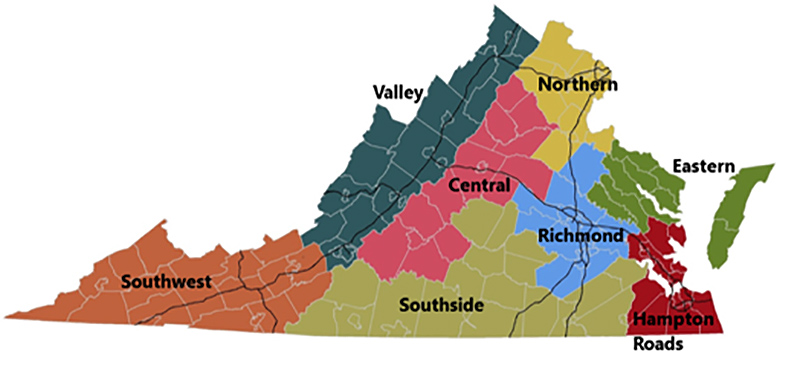
Using data reflecting shared economic conditions, such as cost of living, and commonly accepted geographical boundaries, the Cooper Center’s eight regions are the Valley, Southwest, Southside, Central, Northern, Richmond, Eastern and Hampton Roads.
Media Contact
Article Information
July 28, 2014
/content/latest-demographic-profiles-show-vast-disparities-among-virginia-s-regions