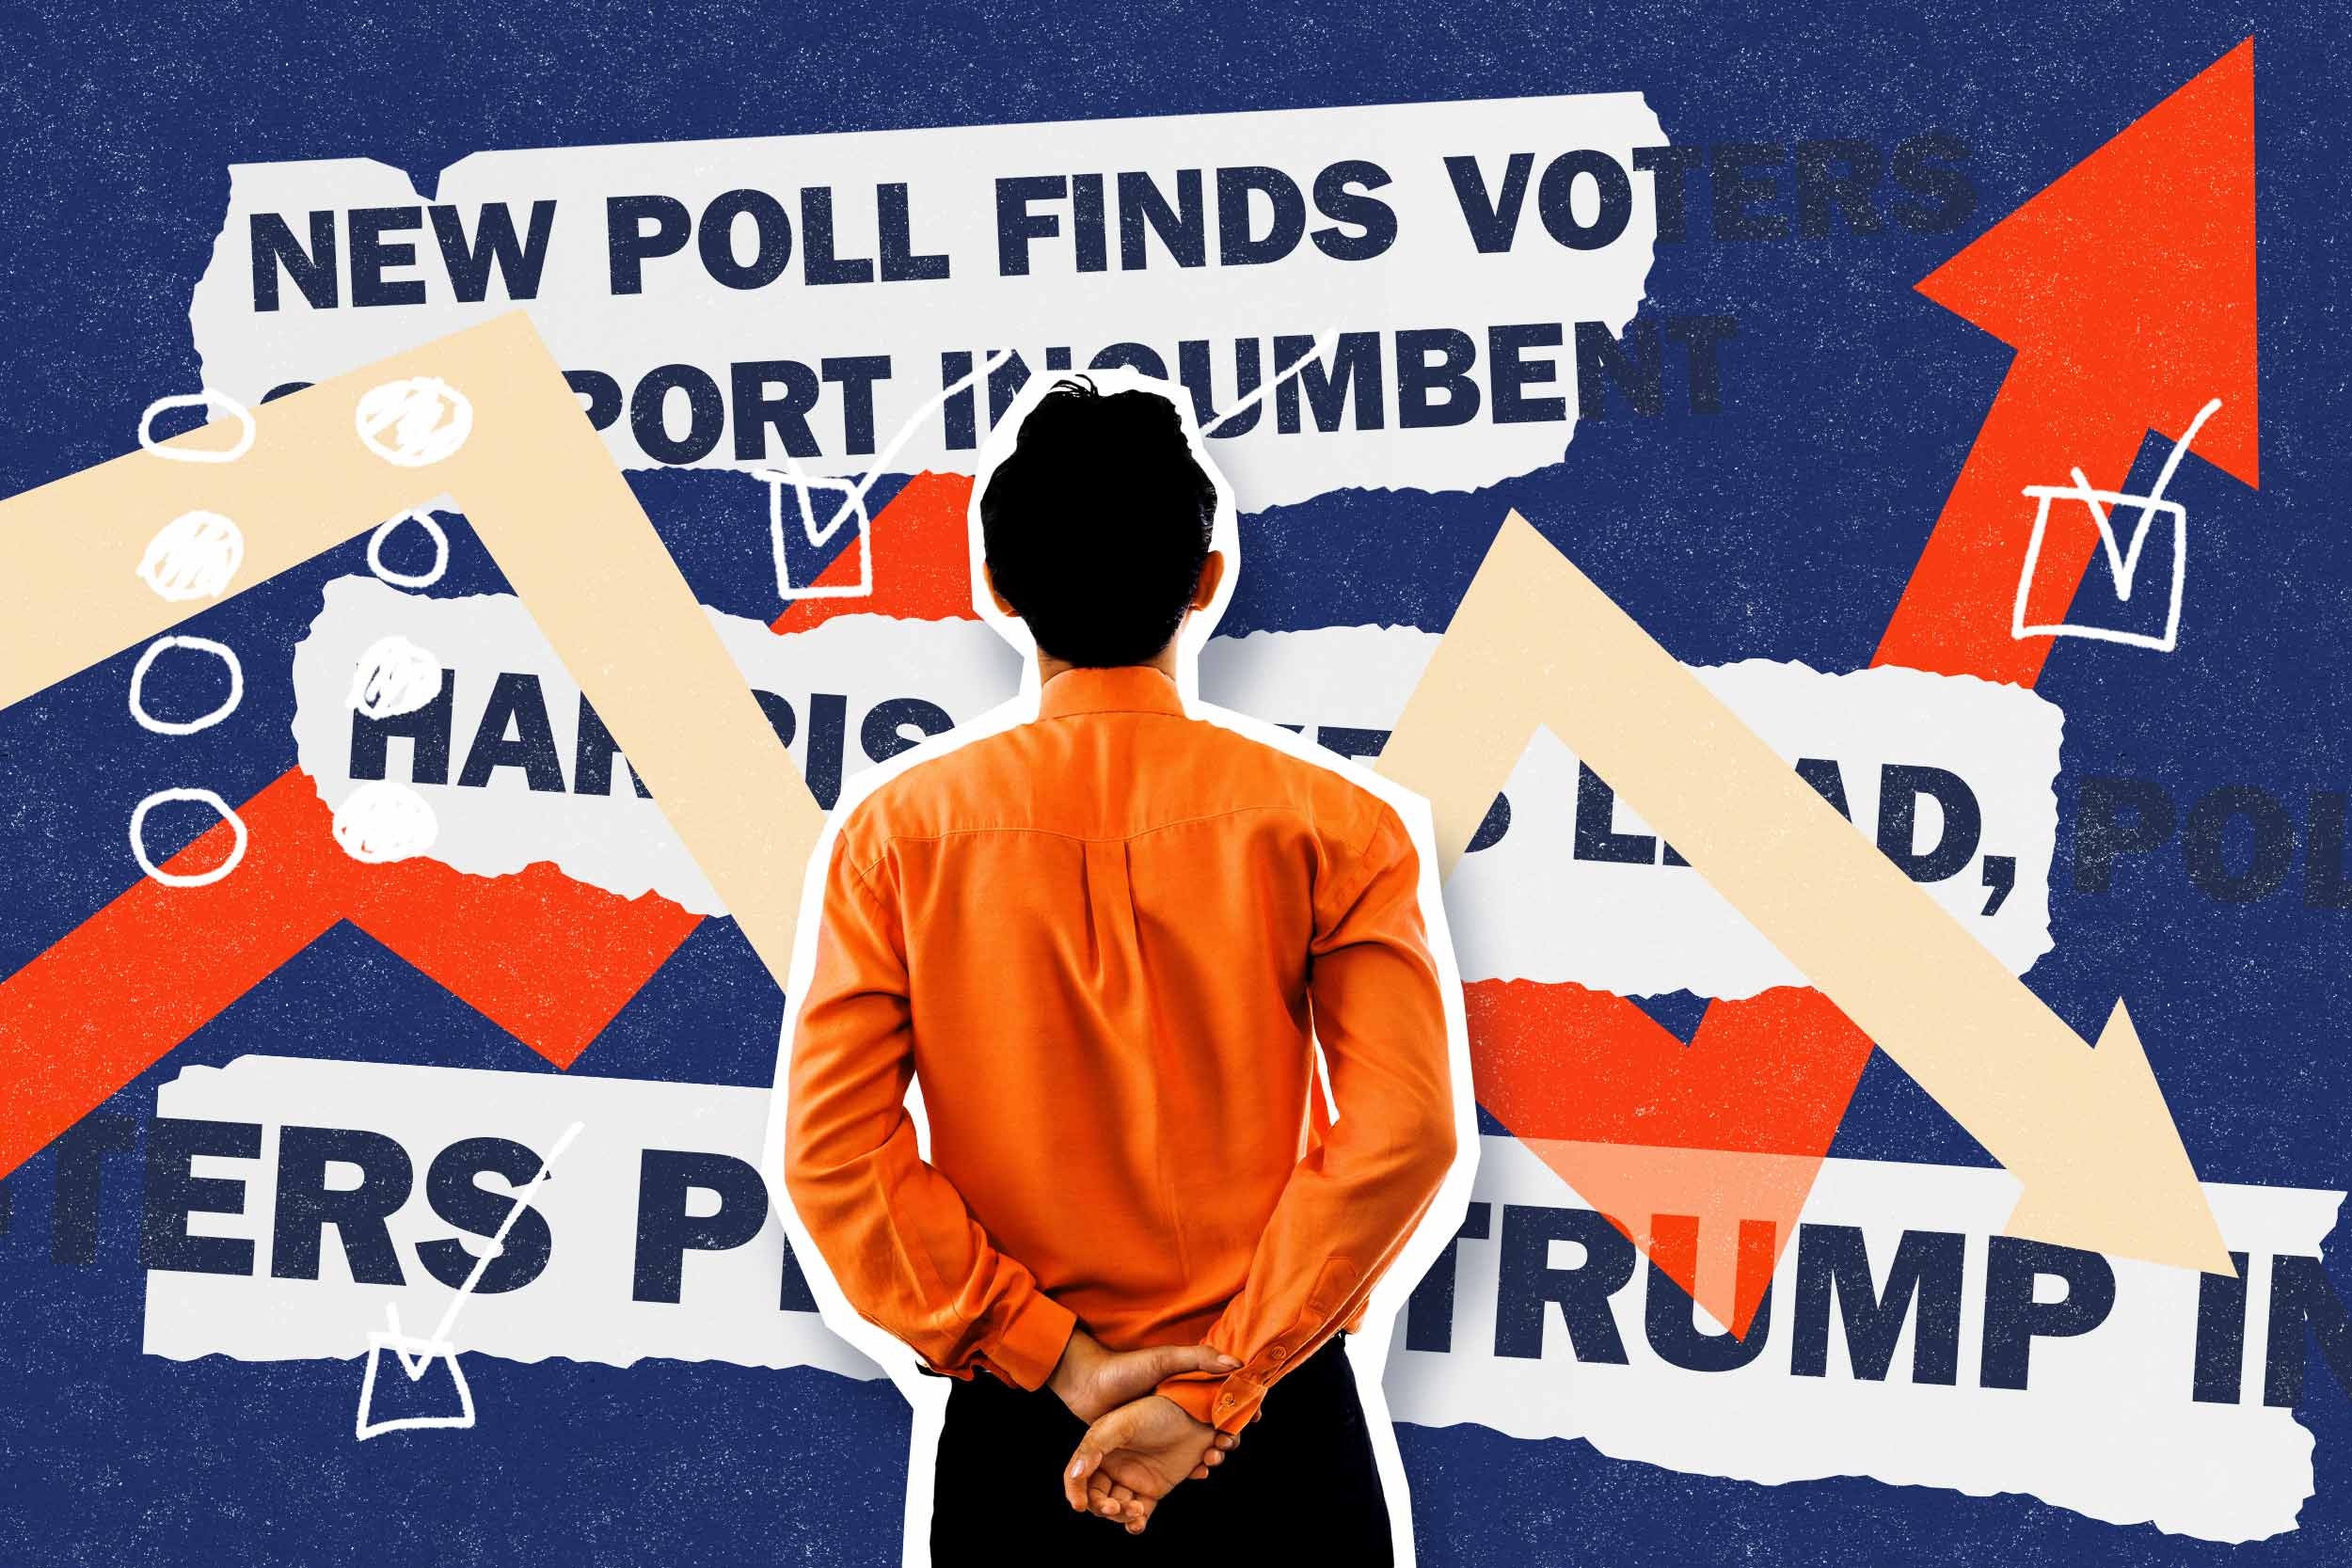
From television to radio to online news organizations, the buzz around the presidential election is full of pundits and polls predicting winners and losers. Unfortunately, the winners, losers and margins seem to change every day with every poll. In an essay on the University of Virginia Miller Center for Public Affairs’ Election 2024 blog, UVA professors Jennifer Lawless, the Leone Reaves and George W. Spicer Professor of Politics, and Paul Freedman, associate professor of politics, suggest strategies to avoid polling whiplash.
But Who’s Winning? 5 Things To Watch When Watching the Polls
If you’re obsessed with the polls (like we are), you might be having a hard time keeping track of who is up, who is down and how the dynamics of the presidential race keep changing. You also might be wondering how to reconcile polls that show different results, even when they’re conducted by the same pollster or on the same day.
There’s been lots of attention, for example, to The New York Times-Siena poll that showed Vice President Kamala Harris up by four points in Pennsylvania against the backdrop of a tied race nationally. Similarly, a series of polls out last week from the same source show former President Donald Trump leading across the Sunbelt, despite earlier reports of Harris gaining ground in Arizona, North Carolina and Georgia.

UVA Department of Politics professors Jennifer Lawless and Paul Freedman say that not all polls are created equal. (Contributed photos)
As poll watchers risk whiplash and struggle to read the tea leaves of every one-point post-convention/post-debate/post-assassination attempt fluctuation, we risk missing the forest for the (many, many) trees. The race itself is historically close and has changed relatively little since Harris became the nominee just two long months ago.
Of course, amid a historically close race, “relatively little” can mean everything. But it’s still important not to overinterpret shifts in the polls. As we continue to obsess over the torrent of polling data throughout the next six weeks, here are five principles to keep in mind:
Pay Attention to the Pollster
Not all polls are created equal. Some have better track records, some have better samples, some are better than others when it comes to explaining who they polled and how they did it. If you’re interested in various pollsters’ track records and reputations, ABC News’ “538” offers pollster ratings. Scores are based on the historical record and methodological transparency of each polling firm.
Pay Attention to Who and When
“Registered voters,” for example, are less likely to turn out on Election Day than “likely voters.” It’s tricky to measure who a “likely voter” is, and different survey organizations do this differently and almost never explain how. As a general rule, though, surveys of likely voters will have more predictive power than surveys of registered voters.
Pay Attention to Margins of Error
A national poll of 1,000 respondents has a margin of error of about 3 percentage points. This means that if a candidate is polling at 48%, that person’s support could be as low as 45% or as high as 51%. The smaller the sample size, the larger the margin of error. A state poll of 700 people, for example – as in this week’s Times-Siena poll – typically has a margin of error of about 3.7 points.
Importantly, these margins of error are estimated for the entire sample. Once you break down the results by party or gender or race, the margin of error increases. In a state poll of 700, if women comprise half the sample, then any analyses restricted just to women carry a margin of error of more than five points. Notice that most of these margins are significantly larger than the 1- to 3-point advantage that Harris or Trump enjoys in the battleground states. And if the margin of error is greater than the spread separating the candidates, the result is a statistical tie.
The Margin Isn’t the Only Source of Error
It’s the one we focus on because it’s relatively easy to quantify (it’s based on a mathematical formula). But beyond this kind of sampling error – which is random – we must also be concerned about systematic sources of error, such as an unrepresentative sample, differential response rates among politically relevant groups, unclear or biased question wording, or implications of question order.
Most high-quality pollsters release the exact questions they asked and the order in which they asked them. Click on those links when you read poll results so that you’re fully informed about the entire poll, not just the head-to-head questions most news outlets highlight.
Don’t Pay Too Much Attention to a Single Poll
There’s no way to tell if an outlier is right until more data come in. Instead, take advantage of polling aggregators, like The New York Times or 538. But keep in mind that, like polls themselves, not all aggregators are created equal. RealClearPolitics, for example, reports a simple average of polls, treating every poll the same. Other aggregators give more weight to pollsters with a better track record, to polls with larger samples, or to those fielded more recently.
At the end of the day, we would all rather our favored candidate be up than down – even within the margin of error. And we’re going to take solace in the polls that work for us and try to debunk those that work against us. Such impulses are understandable.
But obsessing over and extrapolating too much from the constant flow of new polls – beyond the conclusion that this is, in fact, a very close race – is probably not time well spent and not worth the whiplash.
OK, we’re going back to obsessing about the polls now.
Media Contact
Article Information
July 1, 2025


