Q&A: How do you weave data into art?

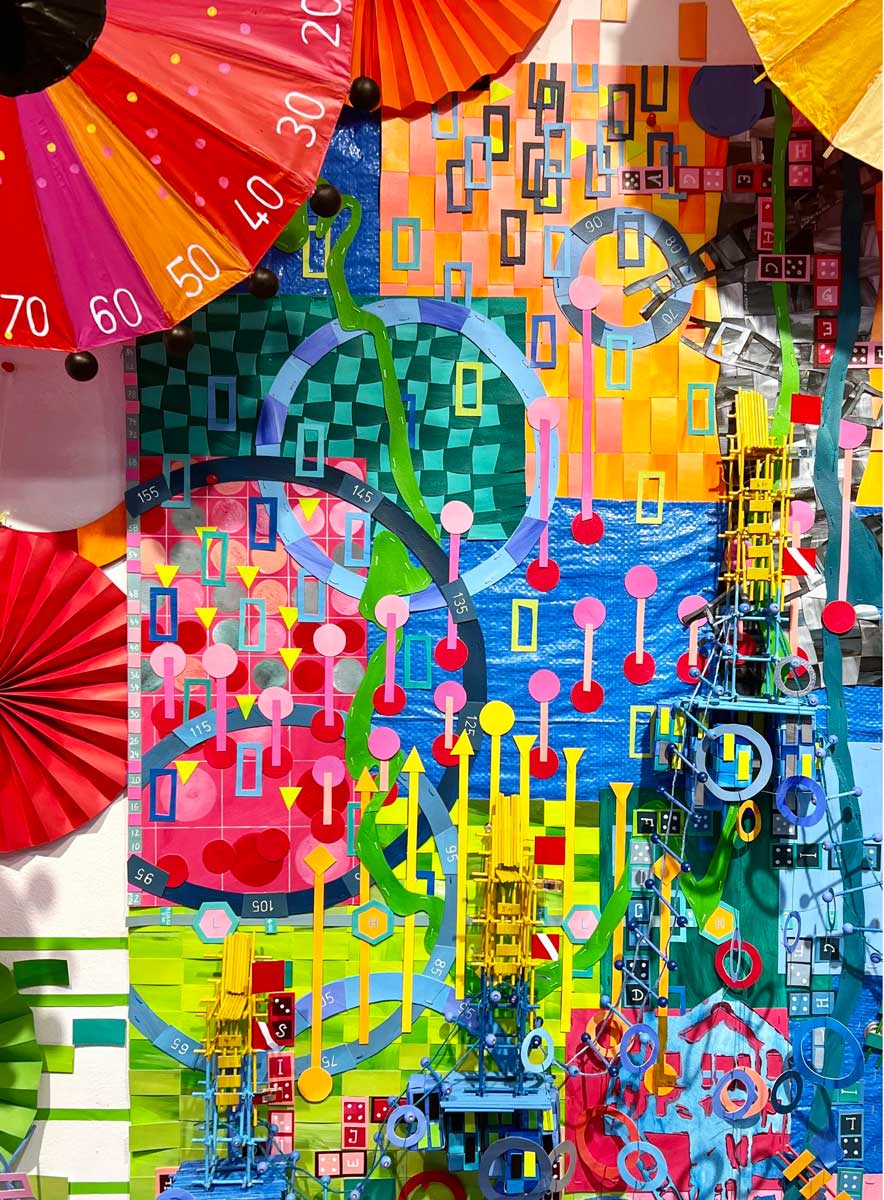
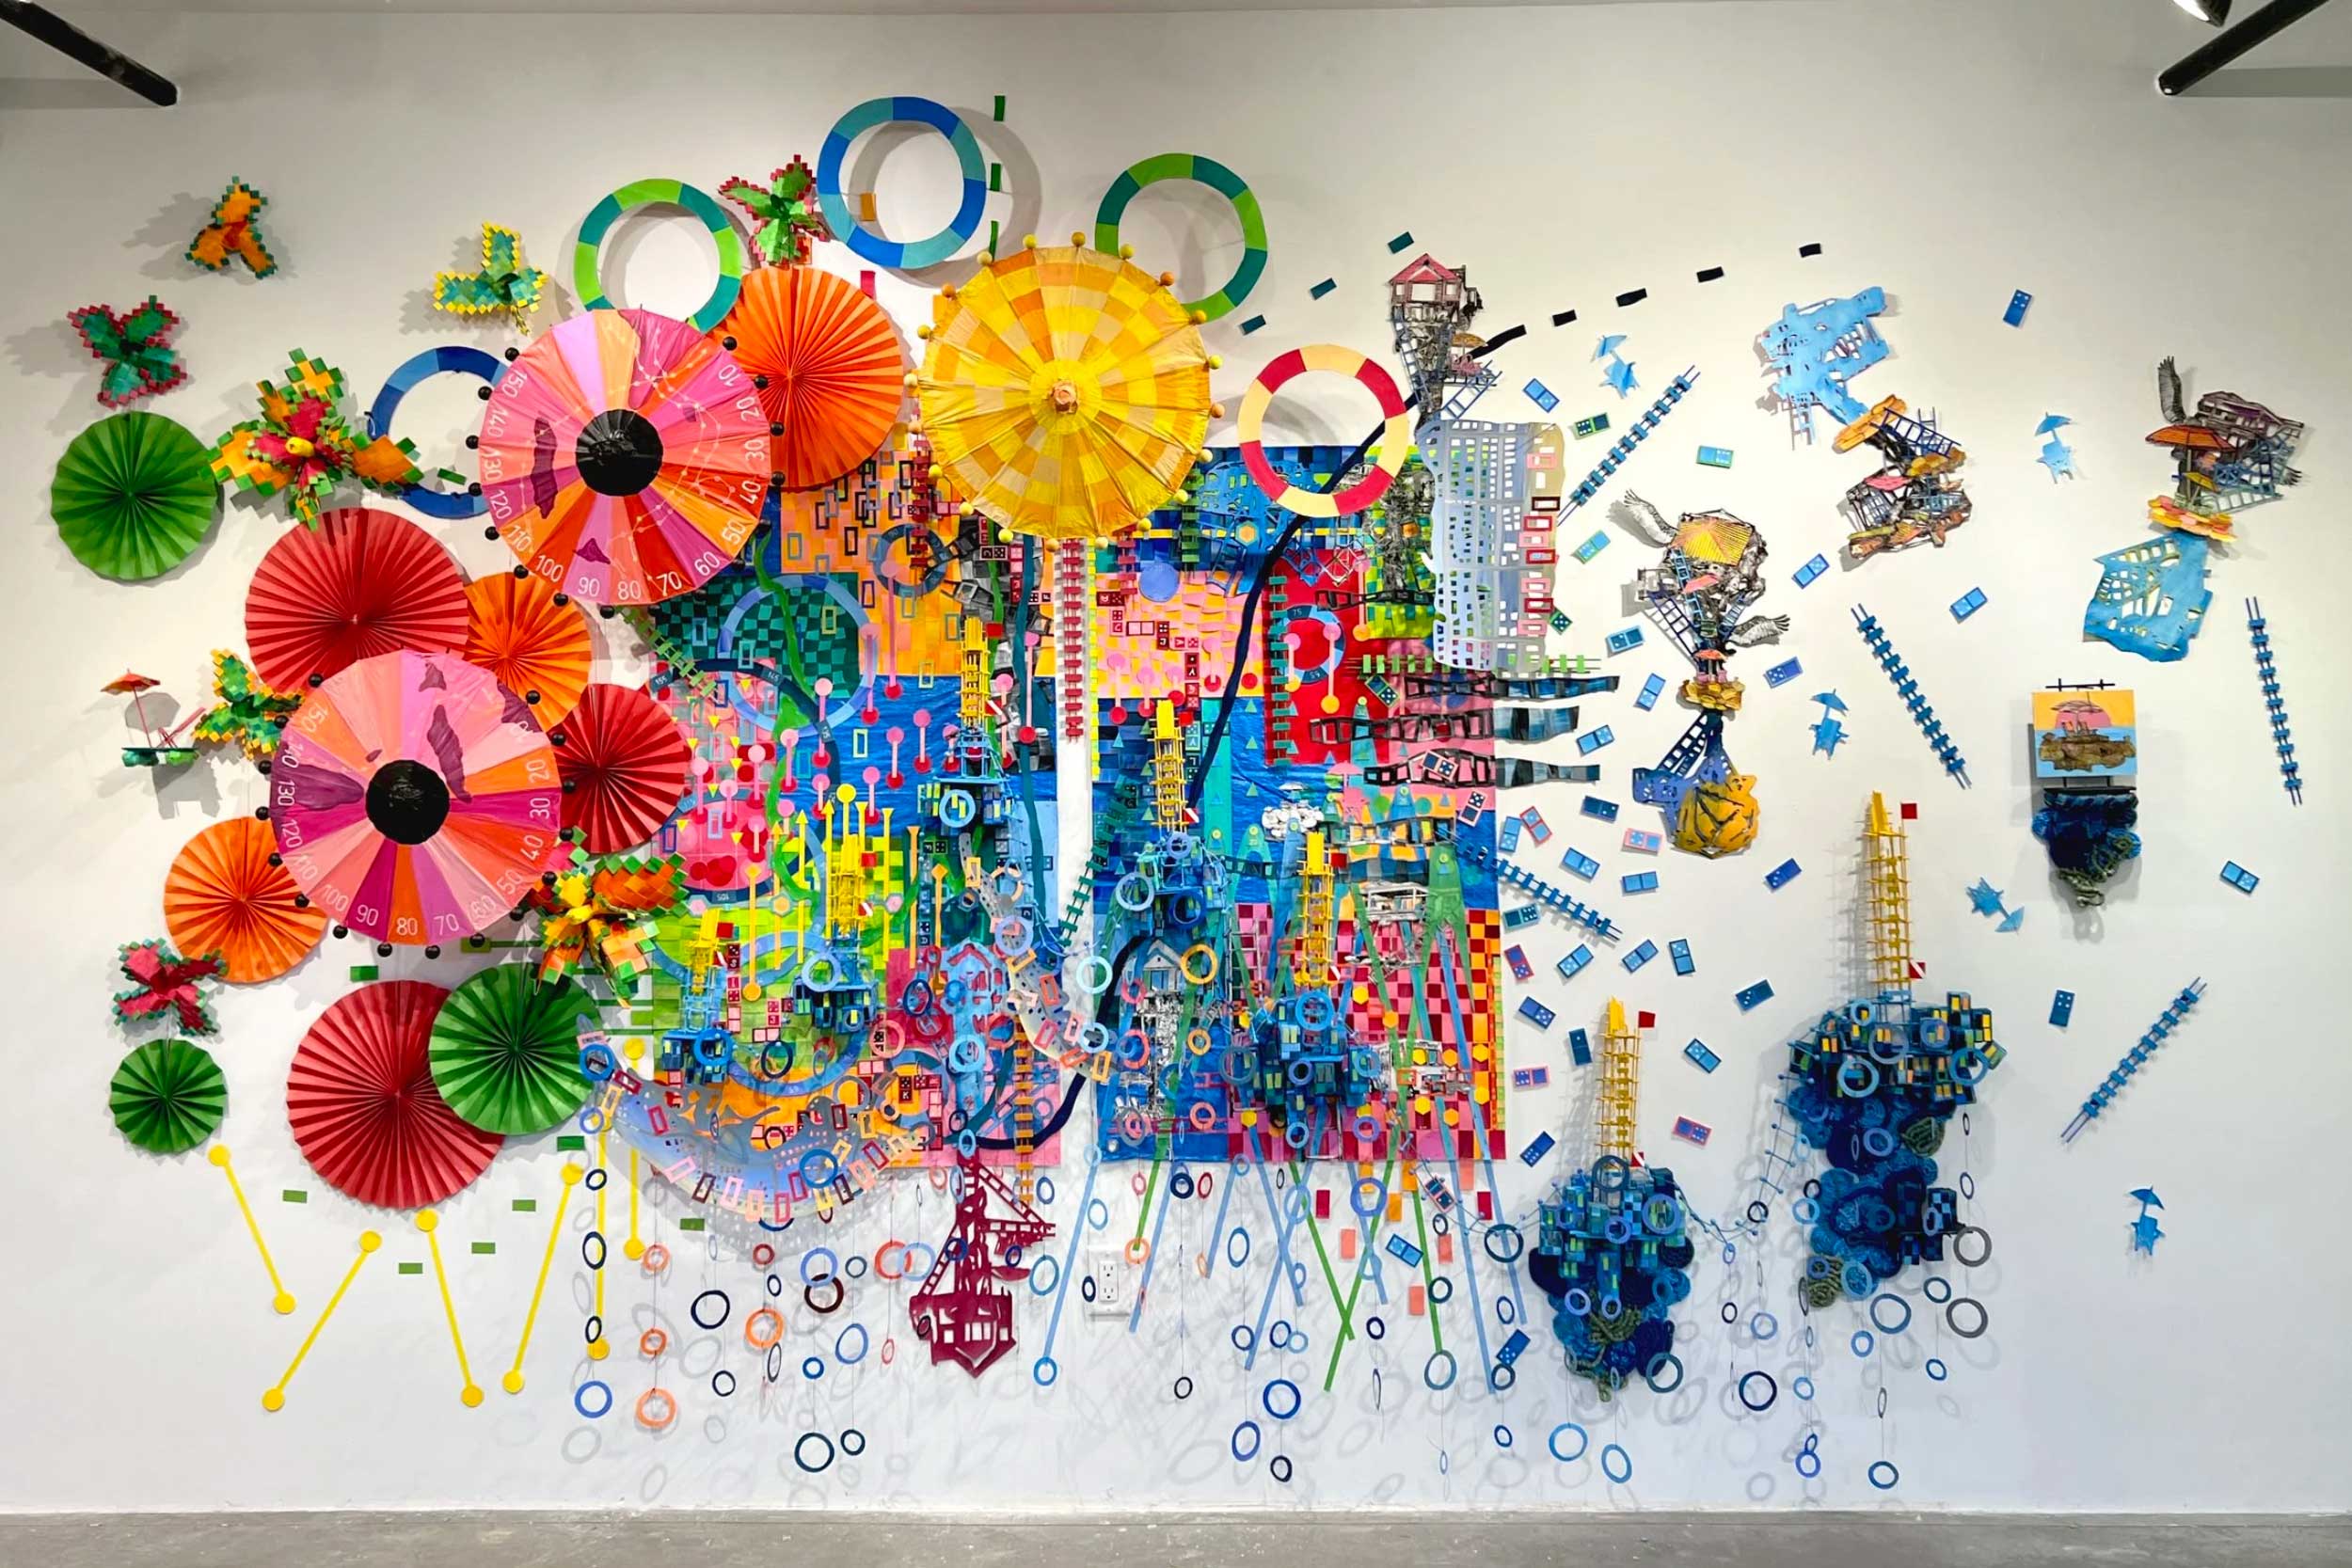
For nearly 25 years, Nathalie Miebach has translated scientific data into woven sculptures, installations and musical scores. Challenging the traditional presentation of science and data, she transforms quantitative information into tactile, narrative forms.

Beginning Monday, she joins the University of Virginia’s School of Data Science as its inaugural artist-in-residence. During her weeklong residency, she will invite the UVA community to experience data in unexpected ways through a workshop, a live musical performance, classroom visits and more.

Miebach spoke with UVA Today about the upcoming events, her journey to this work and what she most looks forward to.

Portrait of Nathalie Miebach

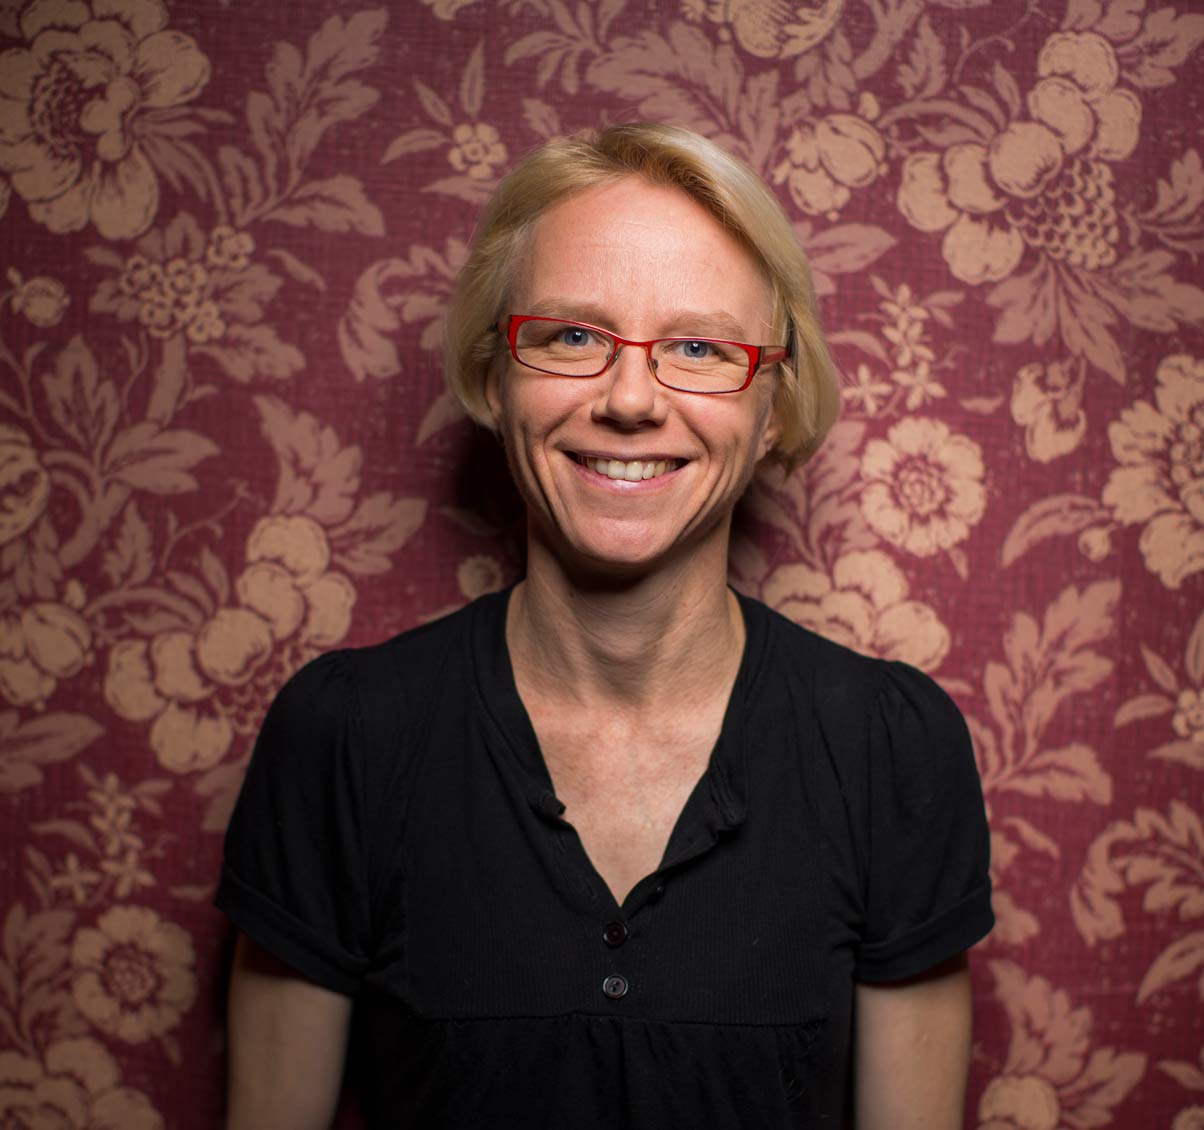
Miebach is the UVA School of Data Science’s first artist-in-residence. (Contributed photo)

Q. What led you to do the work you do?

A. I became a sculptor because of my interest in science. Like many people, I learn through my hands, by building things or taking them apart.

When I was in my 30s, I started taking night classes at Harvard University Extension School in astronomy. I found myself studying this incredible science while looking for a tactile medium to study it with. Through pure chance, I happen to be taking a basketweaving class nearby, which presented itself as the perfect medium to use. The first pieces I made were direct 3D translations of graphs from my astronomy book. From there, I went on using the weave not just as a matrix to build forms with, but actually translate data. Right from the start, it was a really great medium to address other questions I had about science.

Several years later, I switched my focus to climate change and weather. The problem with astronomy is that you get a lot of data sets that someone else has collected, cleaned up and edited. I wanted to know how collecting the data myself would change the way I think about sculpture and its role in the translation process. I focused on topics of weather and climate change because there’s so much accessible data.

After a while, I became more interested, not just so much in how weather is measured, but how we as a species respond to it. That’s when music and metaphor started to enter the translation process.

UVA’s 10th Presidential Search - Take the survey. Nominate candidates.

Q. You have a busy week planned next week. What’s on the schedule?

A. It’s going to be a combination of class visits, individual meetings with researchers of the School of Data Science, as well as planned events. On Oct. 21, I’ll host a workshop where students will build 3D structures, weaving their personal experiences with data they’re collecting. Part of the purpose of the workshop is for us to think about how we incorporate both numerical information and personal observations into a piece. Then, there’ll be an artist talk on Oct. 23, along with a performance of one of my scores at the Capital One Hub.

Q. What are you most looking forward to?

A. I’m really looking forward to seeing the school and meeting people who use data in very different ways. When I am in my studio, I naturally develop habits of looking and interpretation with data that can, over time, become blinders. So, I’m really looking forward to seeing how the students are working with data and what they’re thinking.

One of the big questions for me is, “How do you fail with data, and why it is important to do so?” Coming from the craft world, the first thing you learn is that you have to fail with your material a thousand times to really understand where its parameters lie. I struggle all the time to explore how not just to repeat what I’ve done in the past. How do I make sure that the piece I’m creating is allowing data to go to a territory it hasn’t been to before?

Up close look at an example of Nathalie Miebach’s art, a visual interpretation of data

Using different mediums like basket weaving and sculptures, Miebach challenges conceptions of how data can be presented. (Contributed photo)

Q. What are you currently working on?

A. I just finished a large installation for the Arkansas Museum of Fine Arts called “Under a Restless Sky.” It’s a large-scale installation that also functions as a musical score, and it looks at current and future weather changes in the southeast of the United States. Embedded in a visual translation of information are a lot of musical references. I’m working right now with a composer named Riley Nicholson, who is from Arkansas, on a musical performance based on the installation that will be performed in the fall of 2026 in Little Rock, Arkansas.

I’m building a piece right now for an upcoming show called “The Data at Hand: Data Physicalizations of Earth and Space,” curated by Northeastern University that will open Jan. 8. The sculpture is about a bird called the Swainson’s warbler and looks at how it is adapting to increased extreme weather events. Found mostly in the southeastern United States and Caribbean, it nests in areas that have been ravaged by tornadoes or hurricanes and has actually adapted to use these piles of debris and ravaged forest as a breeding ground.

We’re not the only species that’s dealing with a changing planet, and I’m always wondering what we can learn from other species to figure out how we can adapt better as well.

Media Contact

Emma Candelier

Director of Communications UVA School of Data Science